

Executive Summary
The Food and Agriculture Organization of the United Nations (FAO) released its June 2026 Food Outlook, providing the most authoritative biannual assessment of global food commodity markets. The report paints a picture of global food markets navigating a delicate transition: after a record 2025/26 season that delivered the largest global cereal harvest in history (3,043 million tonnes, +6.1% YoY), the outlook for 2026/27 points to a moderate decline of 2.0% — not toward scarcity, but toward normalization.
While global food supplies remain historically abundant, with the cereal stocks-to-use ratio projected at a comfortable 31.7%, the report warns that the distribution of these stocks is uneven. Major exporters’ stock-to-disappearance ratios are tightening — from 25.1% to 23.6% for wheat — signaling that trade-relevant availabilities are less ample than headline stock figures suggest.
The global food import bill reached a record USD 2,218.4 billion in 2025 (+7.9%), driven overwhelmingly by high-value commodities rather than broad-based food inflation. Coffee, tea, cocoa, and spice imports alone surged by USD 62.5 billion (+33.3%), accounting for more than one-third of the total increase.
Key cross-cutting themes in this edition include: (1) the deepening linkages between energy and food markets through ethanol-sugar dynamics and fertilizer costs; (2) the impact of the Near East conflict on trade flows through the Strait of Hormuz — a structurally critical corridor for fertilizer supply chains; (3) the anticipated emergence of El Niño conditions posing significant downside risk to 2026/27 production; and (4) the persistent vulnerability of Low-Income Food-Deficit Countries (LIFDCs) to price shocks and trade disruptions.
Table of Contents
- Global Overview: Markets at a Glance
- Cereals: From Record Highs to Controlled Easing
- Wheat: Tightening Exporter Stocks, Concentrated Supply Risks
- Coarse Grains: Second-Highest Output on Record
- Rice: Large Carryover Buffers Against Production Decline
- Oilcrops: Diverging Fortunes — Tight Vegetable Oils, Ample Oilmeals
- Sugar: Market Shifts Toward Surplus, Ethanol Links Strengthen
- Meat and Meat Products: Tight Supplies, Elevated Prices
- Milk and Milk Products: Slowing Growth, Diverging Product Dynamics
- Fish and Aquatic Products: Aquaculture Leads Growth
- Fertilizer Market Update: Cost Pressures and Trade Disruptions
- Market Indicators: Futures, Freight, Food Import Bill, FAO Price Indices
- Special Features: Maritime Decarbonization and the Ethanol-Sugar Nexus
- Data Summary Tables
- Cover Image Prompt
1. Global Overview: Markets at a Glance
1.1 FAO Food Price Index
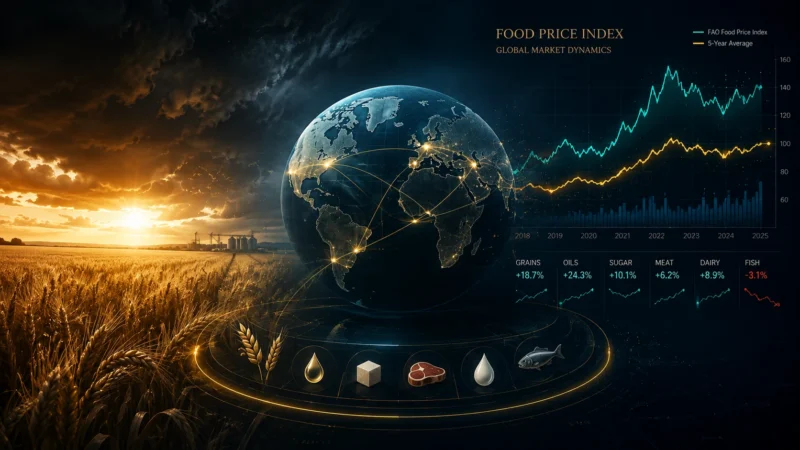
As of May 2026, the FAO Food Price Index (FFPI) averaged 130.8 points, remaining broadly stable from April but 3.5% above its October 2025 level. The FFPI remains 18.4% below its March 2022 peak, signaling that global food price inflation is contained overall — though significant divergences exist across commodity groups.
Table 1: FAO Food Price Index and Sub-Indices (Jan–May 2026)
| Index | Jan–May 2026 Average | YoY Change | Direction |
|---|---|---|---|
| FAO Food Price Index | 128.0 | +0.6% | Broadly stable |
| Cereals | 110.4 | +2.3% | Moderately higher |
| Vegetable Oils | 181.0 | +11.9% | Strongly higher |
| Meat | 128.1 | +3.9% | Moderately higher |
| Dairy | 120.0 | -18.2% | Significantly lower |
| Sugar | 90.5 | -41.5% | Sharply lower |
Table 2: FAO Food Price Index Monthly Values (Oct 2025–May 2026)
| Month | FFPI | Cereals | Veg Oils | Meat | Dairy | Sugar |
|---|---|---|---|---|---|---|
| Oct 2025 | 126.4 | 103.8 | 169.4 | 125.0 | 141.7 | 94.1 |
| Nov 2025 | 125.2 | 105.6 | 165.0 | 125.5 | 136.2 | 88.6 |
| Dec 2025 | 124.5 | 107.2 | 165.2 | 124.8 | 128.2 | 90.7 |
| Jan 2026 | 124.1 | 107.5 | 168.6 | 124.9 | 120.7 | 89.8 |
| Feb 2026 | 125.5 | 108.7 | 174.2 | 126.5 | 119.4 | 86.2 |
| Mar 2026 | 128.7 | 110.4 | 183.1 | 128.0 | 121.2 | 92.8 |
| Apr 2026 | 131.0 | 111.3 | 193.9 | 130.4 | 119.7 | 88.5 |
| May 2026 | 130.8 | 114.3 | 185.0 | 130.5 | 119.2 | 95.1 |
The FFPI’s relative stability masks offsetting movements: cereals (+10.1%), vegetable oils (+9.2%), and meat (+4.4%) all rose from October 2025 to May 2026, while dairy fell sharply (-15.9%) and sugar posted limited net change.
1.2 Global Macroeconomic Context
The June 2026 Food Outlook is released amid heightened economic uncertainty. While the global economy has shown resilience, the growth outlook has become more fragile and uneven across regions. Inflation remains subject to considerable uncertainty, with geopolitical tensions, volatile energy markets, and fertilizer price developments posing serious risks of renewed cost pressures. The interaction between evolving trade policy settings, shifting trade dynamics, and exchange rate movements continues to cloud global trade prospects.
2. Cereals: From Record Highs to Controlled Easing
2.1 2025/26: A Record Season
The 2025/26 (July/June) marketing season concluded with the largest global cereal harvest on record: 3,043 million tonnes, up 6.1% from 2024, driven by higher outputs across all major cereals, particularly maize.
Table 3: World Cereal Market at a Glance
| Indicator | 2024/25 | 2025/26 estim. | 2026/27 f’cast | Change 2026/27 over 2025/26 |
|---|---|---|---|---|
| Production (Mt) | 2,867.6 | 3,043.3 | 2,982.1 | -2.0% |
| Trade (Mt) | 485.2 | 508.6 | 507.2 | -0.3% |
| Total Utilization (Mt) | 2,876.1 | 2,952.5 | 2,969.3 | +0.6% |
| — Food | 1,200.6 | 1,213.4 | 1,225.4 | +1.0% |
| — Feed | 1,084.5 | 1,131.4 | 1,137.2 | +0.5% |
| — Other Uses | 590.9 | 607.7 | 606.7 | -0.2% |
| Ending Stocks (Mt) | 869.5 | 952.2 | 949.0 | -0.3% |
Supply and Demand Indicators:
| Indicator | 2024/25 | 2025/26 | 2026/27 |
|---|---|---|---|
| World Stocks-to-Use Ratio | 29.4% | 32.1% | 31.7% |
| Major Exporters Stocks-to-Disappearance | 20.2% | 23.9% | 22.5% |
| Per Capita Food Consumption (World, kg/yr) | 147.1 | 147.4 | 147.6 |
| Per Capita Food Consumption (LIFDC, kg/yr) | 140.7 | 140.9 | 140.4 |
FAO Cereal Price Index (Jan–May average): 110 (2014–2016=100), +5% YoY, though still well below the May 2022 peak and the five-year average.
2.2 2026/27 Outlook: Moderate Decline
For 2026/27, global cereal production is forecast to decline by 2.0% to 2,982 million tonnes. All major cereals are expected to contract from 2025/26 record levels. The FAO characterizes this as easing from record highs while remaining at historically elevated levels. Global trade is forecast to decline slightly (-0.3% to 507.2 Mt), while utilization continues to rise (+0.6% to 2,969 Mt), driven by steady food and feed demand. Ending stocks are forecast at 949.0 million tonnes, the second-highest on record, with the global stocks-to-use ratio essentially stable at 31.7%.
3. Wheat: Tightening Exporter Stocks, Concentrated Supply Risks
Global wheat production is forecast to decline by 3.8% to 810.9 million tonnes in 2026/27, driven primarily by smaller harvests among major exporting countries. The outlook has been revised downward in recent months, reflecting persistent adverse weather in key producing countries and weakening planting intentions in the southern hemisphere due to rising input costs.
Table 4: World Wheat Market at a Glance
| Indicator | 2024/25 | 2025/26 estim. | 2026/27 f’cast | Change |
|---|---|---|---|---|
| Production (Mt) | 798.2 | 842.6 | 810.9 | -3.8% |
| Trade (Mt) | 193.0 | 205.9 | 199.1 | -3.3% |
| Total Utilization (Mt) | 794.0 | 804.0 | 806.1 | +0.3% |
| — Food | 535.7 | 539.7 | 544.3 | +0.9% |
| — Feed | 160.6 | 165.8 | 165.1 | -0.4% |
| Ending Stocks (Mt) | 313.5 | 346.8 | 348.6 | +0.5% |
| Stocks-to-Use Ratio | 39.0% | 43.0% | 42.5% | -0.5pp |
| Major Exporters Stocks-to-Disappearance | 19.4% | 25.1% | 23.6% | -1.5pp |
Table 5: Wheat Production — Leading Producers (million tonnes)
| Country | 2025 estim. | 2026 f’cast | Change | Key Driver |
|---|---|---|---|---|
| China (Mainland) | 140.1 | 140.0 | -0.1% | Stable |
| European Union | 144.3 | 136.2 | -5.6% | Smaller area, yield normalization |
| India | 117.9 | 120.2 | +1.9% | Record; historically high sowings, government incentives |
| Russian Federation | 91.1 | 85.9 | -5.7% | Smaller area, lower yields |
| United States | 54.0 | 42.5 | -21.3% | Multi-year low; drought + smaller plantings |
| Canada | 40.0 | 35.0 | -12.4% | Farmers shifting to better-priced crops |
| Australia | 36.0 | 30.0 | -16.6% | Below-average rainfall, elevated input costs |
| Ukraine | 23.3 | 22.7 | -2.5% | Improved yields offset smaller area |
| Argentina | 27.9 | 22.5 | -19.4% | Yield normalization from exceptional 2025 |
| Kazakhstan | 18.0 | 14.0 | -22.2% | Yield normalization |
| Türkiye | 18.0 | 22.8 | +26.7% | Improved rainfall |
| Iran | 12.0 | 13.7 | +14.2% | Better moisture conditions |
Key Analytical Points:
- Concentrated production decline among exporters. Six of the eight major wheat exporters — the EU, Russia, the US, Canada, Australia, and Kazakhstan — are all forecast to harvest less. This concentration of supply reduction among exporters is what tightens the major exporters’ stock-to-disappearance ratio to 23.6%.
- India as the primary offset. India’s record harvest of 120.2 Mt — driven by historically high sowings and continued government procurement incentives — provides a critical cushion. However, since India primarily supplies its domestic market (re-emerging as an exporter only with 2.5 Mt forecast after a near four-year export ban), its stocks do not directly ease trade-relevant tightness.
- US drought the most severe single-event shock. Production forecast at 42.5 Mt would represent a 21.3% decline, the lowest in multiple years.
- North Africa recovery after two drought years. Algeria and Morocco are forecast to rebound significantly.
- Global stocks-to-use ratio remains comfortable at 42.5%, but stock concentration in Asia (primarily China and India) means that export-accessible inventories are significantly tighter than the headline suggests.
Wheat trade is forecast to contract by 3.3% to 199.1 Mt in 2026/27, driven by both weaker import demand (improved domestic production and ample carryover stocks in Egypt, Algeria, Morocco, Iran, Syria, Tunisia) and reduced exportable supplies from several major exporters. The Russian Federation is expected to remain the world’s leading wheat exporter at 45.0 Mt despite a smaller crop, while EU and Ukraine exports expand.
Keywords: FAO Food Outlook June 2026, global food markets 2026, world cereal production 2026/27, global wheat production forecast, FAO food price index 2026, global rice market outlook, sugar ethanol price linkage, global meat production 2026, dairy market outlook 2026, fertilizer market update 2026, global food import bill 2025, ocean freight rates 2026, El Niño food production impact, Strait of Hormuz food trade disruption, FAO fish price index 2026






No comments yet