

Table of Contents
- Executive Summary
- Part 1: Market Review — A Year of Upheaval
- 2.1 Critical Mineral Price Trends
- 2.2 Demand Growth Driven by Energy Technologies
- 2.3 Supply Concentration: New Records in Refining
- 2.4 Geopolitical Implications: Export Controls Shock
- 2.5 Middle East Conflict: Ripple Effects Across Value Chains
- 2.6 Investment Trends: Capital Spending Diverges
- 2.7 Latest Policy Developments
- 2.8 Sustainability Performance Tracking
- Part 2: Outlook for Key Minerals
- 3.1 Outlook Overview: Supply Gaps, Investment Needs, Diversification
- 3.2 Copper Outlook: Record Prices, Structural Deficits, Smelter Crisis
- 3.3 Lithium Outlook: Fastest-Growing Critical Mineral
- 3.4 Nickel Outlook: Indonesia’s Dominance and Policy Shifts
- 3.5 Cobalt Outlook: DRC Export Quotas Transform the Market
- 3.6 Graphite Outlook: Persistent Overcapacity Meets Strategic Demand
- 3.7 Rare Earth Elements Outlook: Export Controls as a Catalyst for Diversification
- Part 3: Strategic Implications
- Key Takeaways
Executive Summary
The IEA’s Global Critical Minerals Outlook 2026 arrives at what may be the most turbulent moment in critical mineral markets in decades. Several converging forces are reshaping the global landscape:
- Prices rebounded sharply in 2025, with strategic minor minerals surging on export controls, and copper hitting record highs above USD 14,000 per tonne in May 2026.
- China tripled its export-controlled tariff codes since 2023, covering tungsten, rare earths, graphite, gallium, germanium, antimony, and battery supply chains — fundamentally altering trade flows.
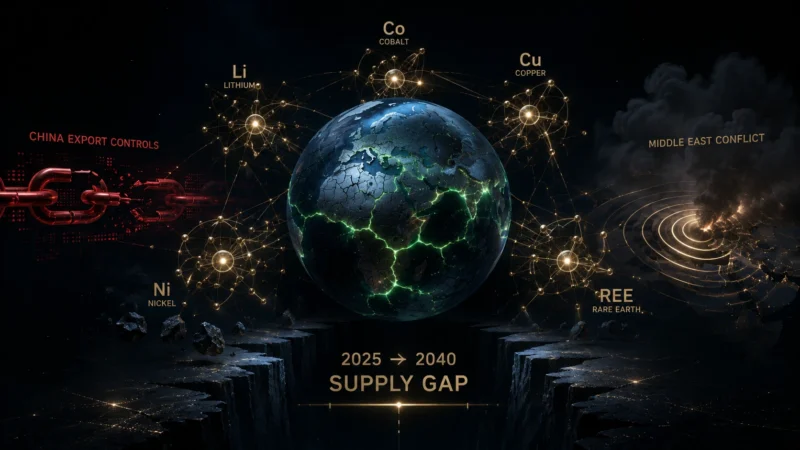
- The Middle East conflict beginning February 2026 disrupted 8% of global aluminium production and half of seaborne sulphur trade, with cascading effects on copper, nickel, cobalt, lithium processing, and fertilizers.
- Refining concentration reached new record levels, with the top supplier’s average share at 72% in 2025. China dominates refining across copper (~50%), lithium (75%), cobalt (75%), rare earths (85%), and battery-grade graphite (>90%).
- Over USD 750 billion in cumulative capital investment is needed across key energy mineral value chains by 2040 in the Stated Policies Scenario (STEPS).
- Supply gaps persist through 2035 for copper (~25% deficit) and lithium (~25% gap), while nickel’s gap widens slightly. Cobalt faces a deficit from 2026 due to DRC export restrictions.
- Government policy responses accelerated dramatically — from the US’s Project Vault (USD 12 billion strategic reserve) to the Quad Critical Minerals Initiative (USD 20 billion mobilization target), to the G7 rare earth diversification target of <60% from any single non-G7 supplier by 2030.
Part 1: Market Review — A Year of Upheaval
2.1 Critical Mineral Price Trends
2025 marked a broad-based price recovery across critical minerals, though the recovery was highly uneven across categories.
| Mineral Category | Price Trend (Jan 2025 – Apr 2026) | Key Drivers |
|---|---|---|
| Strategic Minor Minerals | Strongest rally (index surged since 2024) | Export controls, robust demand, small market sizes |
| Base Metals | Strong rise (aluminium +10%, copper records) | Tight supply, resilient demand |
| Battery Materials | Recovery from 2023-2024 lows (lithium +100%, cobalt +120%) | Supply constraints, export restrictions |
| Rare Earths | Strong increases post-export controls | China’s April and October 2025 controls |
| Alloy Metals | Modest edge up | Secondary to base metals |
Table 1: Price Changes for Selected Critical Minerals, January 2025 – April 2026
| Mineral | Price Change | Mineral | Price Change |
|---|---|---|---|
| Tungsten | ~620% surge | Cobalt | ~120% increase |
| Tantalum | ~170% increase | Neodymium | ~110% increase (Oct 2025 – Feb 2026) |
| Lithium | ~100% increase (near-doubled) | Praseodymium | ~100% increase |
| Indium | >100% increase | Tin | ~40% increase in 2025 |
| Bismuth | ~100% increase | Nickel | +20% since end-2025 |
Copper prices reached record highs exceeding USD 14,000 per tonne in May 2026, driven by major mine disruptions (Grasberg mudflow, Kamoa-Kakula flooding), US tariff-driven inventory movements, and structural anticipation of electrification demand. Aluminium hit a four-year high of nearly USD 3,700 per tonne in April 2026 following Middle East production facility damage.
Lithium carbonate prices nearly doubled to approximately USD 20,000 per tonne of lithium carbonate equivalent (LCE) between January 2025 and April 2026, driven by Zimbabwe’s export restrictions, tighter permitting in China’s Jiangxi region, and restocking by downstream cathode buyers. However, prices remain far below the 2022 peak of USD 80,000/t LCE.
Cobalt metal prices approached USD 58,000 per tonne in Q1 2026 — more than triple the prior year — following the DRC’s export ban and subsequent quota system capping exports at 96,600 tonnes (less than half of 2024 production).
A critical price divergence emerged between Chinese domestic and ex-China prices. European prices are approximately five times higher than Chinese domestic prices for gallium and heavy rare earths, and about three times higher for germanium. While ex-China price assessments reflect limited liquidity and fewer transactions, the premium highlights growing challenges in securing supply outside the dominant supplier.
Table 2: China vs. Ex-China Price Divergence (as of April 2026)
| Mineral | European Premium Over China | Notes |
|---|---|---|
| Gallium (99.99%) | ~5x | Export controls suspended to US until Nov 2026 |
| Heavy Rare Earths (Dy, Tb) | ~5x | Export licensing since April 2025 |
| Germanium (99.999%) | ~3x | Export controls suspended to US until Nov 2026 |
Smelter treatment and refining charges (TC/RCs) fell to historic lows — copper benchmark TC/RCs settled at USD 0 per tonne in 2026, while spot charges have been negative since 2024. Zinc and lead smelter fees also turned negative, driven by rapid Chinese smelter capacity expansion outpacing concentrate supply growth.
2.2 Demand Growth Driven by Energy Technologies
Demand for key energy minerals — copper, lithium, nickel, cobalt, graphite, and rare earths — grew at a compound rate of close to 10% per year, significantly outpacing base metals like aluminium, lead, and zinc (~1% annually).
Table 3: Demand Growth by Mineral, 2024 vs. 2025
| Mineral | 2025 Demand Growth | Primary Driver | Energy Share of Growth |
|---|---|---|---|
| Lithium | ~23% YoY | EVs and battery storage (storage +60%) | >90% |
| Copper (refined) | +3.7% YoY (to ~28 Mt) | Electrification, data centres, construction | ~75% |
| Nickel | ~3% YoY (to 3.5 Mt) | Battery applications | Rising to ~40% by 2040 |
| Graphite | ~6% YoY (battery grade +14%) | EV and stationary storage | Battery-dominant |
| Cobalt | Moderate growth | EVs offset by LFP shift | 31% today |
| Rare Earths (magnet) | Steady growth | EVs, wind turbines, automation | Magnet-dominant |
Key insight: The energy sector drove, on average, ~75% of demand growth for key energy minerals in 2025, up from 70% in 2024. Lithium was the standout — energy storage demand grew by 60% in 2025, reaching 30 kt, while EV demand reached 170 kt. China alone accounted for ~90% of the increase in global lithium demand.
2.3 Supply Concentration: New Records in Refining
Refining concentration across energy minerals reached new record levels in 2025. The average share of the top refined supplier stood at approximately 72%, up from 70% in 2020.
Table 4: Top Producer Share in Refined Material Production, 2023 vs. 2025
| Mineral | Top Producer | 2023 Share | 2025 Share | Trend |
|---|---|---|---|---|
| Graphite (battery-grade) | China | ~93% | >94% | ↑ |
| Manganese (sulphate) | China | ~95% | ~96% | ↑ |
| Rare Earths (magnet) | China | ~90% | ~85% | ↓ (Malaysia, US gains) |
| Lithium | China | 70% | 75% | ↑ |
| Cobalt | China | ~74% | >75% | ↑ |
| Nickel | Indonesia | ~42% | ~45% | ↑ |
| Copper | China | ~47% | ~50% | ↑ |
The leading producer led supply growth across almost all key energy minerals. Between 2023 and 2025, Indonesia (for nickel) and China (for others) together accounted for over three-quarters of total refined supply growth. In several markets — manganese, nickel, and graphite — almost all supply growth originated from the leading supplier.
Mining concentration presented a more mixed picture. The top producer’s share declined for lithium, graphite, and rare earths between 2023 and 2025:
- Lithium: Growing production in Africa (26-fold increase from 2020, now 14% of global supply) and Argentina diversified supply
- Graphite: Balama mine restart (Mozambique), Lindi Jumbo (Tanzania) reduced top supplier share from 84% to 80%
- Rare Earths: US (MP Materials) and Australia-Malaysia (Lynas) projects reduced top supplier concentration
- Nickel: Concentration increased as Indonesia expanded (Weda Bay) while higher-cost projects elsewhere were curtailed
- Cobalt: DRC remained dominant; Indonesia gaining share (from 1.5% in 2020 to ~15% in 2025)
Table 5: Mineral Reserves Growth, 2010-2025
| Mineral | Reserve Change (2010-2025) | Key Developments |
|---|---|---|
| Natural Graphite | ~400% increase | China, Brazil, Mozambique (new discoveries) |
| Lithium | ~200% increase | Chile, Australia, Argentina |
| Nickel | ~150% increase | Indonesia (from 5% to >40% of global reserves) |
| Cobalt | Notable increase (2020s) | DRC exploration, Indonesia emergence |
| Copper | ~60% increase | Steady growth across producers |
| Rare Earths | Decline (only major group to decline) | US decreases after mine restarts; Russia, Vietnam declines |
2.4 Geopolitical Implications: Export Controls Shock
2025 saw the most significant escalation of critical mineral export controls in recent history. China tripled its controlled tariff codes from December 2023 to April 2025.
Table 6: Export Controls Announced, Proposed, or Updated in 2025-2026
| Material/Technology | By | Date | Global Supply Share | Status |
|---|---|---|---|---|
| Tungsten | China | Feb 2025 | 98% mining, 76% refining | Export licensing |
| Bismuth | China | Feb 2025 | 98% mining, 73% refining | Export licensing |
| Indium | China | Feb 2025 | 98% mining, 86% refining | Export licensing |
| Tellurium | China | Feb 2025 | 98% mining, 73% refining | Export licensing |
| Molybdenum | China | Feb 2025 | 98% mining, 41% refining | Export licensing |
| Rare Earths (7 elements) | China | Apr 2025 | 98% mining, 91% refining | Export licensing |
| LFP Batteries & Equipment | China | Oct 2025 | 99% cell manufacturing | Suspended until Nov 2026 |
| Rare Earths (expanded) | China | Oct 2025 | 91% refining | Suspended until Nov 2026 |
| Graphite (refined) | China | Oct 2025 | 94% refining | Suspended until Nov 2026 |
| Cobalt | DRC | Oct 2025 | 66% mining | Export quota (96,600 t) |
| Nickel Ore | Philippines | Proposed | 11% mining | Proposed ban from 2030 |
| Lithium Concentrate | Zimbabwe | Feb 2026 | 10% mining | Suspended exports |
| Raw Manganese | Gabon | Proposed | 22% mining | Proposed ban from 2029 |
| Bauxite | Guinea | Proposed | 34% mining | Proposed control from Jun 2026 |
| Sulphuric Acid | China | May 2026 | 34% refining | Export halt (until end-2026) |
The value of China’s exports of all items under restriction exceeded USD 11 billion in 2025, up from an estimated USD 8 billion in 2023.
The October 2025 rare earth controls marked a major escalation. For the first time, China’s controls extended to “internationally made” products containing Chinese-sourced materials or manufactured using Chinese technologies — even if traded outside China. The IEA noted: “If the October export controls had been fully enacted, the consequences for many key strategic sectors and global economies would have been exceptional, causing major economic impacts across many sectors.” These were suspended for one year in November 2025, but the underlying risk remains.
Simultaneous battery supply chain controls targeted all critical chokepoints — LFP cathode materials, LFP batteries, graphite anode materials, cathode precursors, and battery production equipment and technologies. The IEA warned: “If fully enacted, the proposed export controls would severely restrict the ability of the rest of the world to produce batteries in the near term.”
Table 7: Impact of China’s Export Controls on Trade Volumes
| Product | Trade Impact |
|---|---|
| Rare earth permanent magnets (NdFeB) | Sharp drop April-May 2025; slow recovery |
| Antimony oxide to Japan, Chinese Taipei, US | Halted since September 2024 |
| Tungsten carbide and powder | Significantly decreased |
| Dysprosium and terbium oxides | Dropped in May 2025, then slowly recovered |
| Spherical graphite to United States | Halted since April 2025 |
| Total spherical graphite exports | -16% in 2025 |
2.5 Middle East Conflict: Ripple Effects Across Value Chains
The conflict beginning February 28, 2026, sent shockwaves through critical mineral value chains beyond the energy market. The IEA identified impacts across multiple commodities:
Table 8: Middle East Conflict — Key Sectoral Impacts
| Sector | Impact | Severity |
|---|---|---|
| Aluminium | 8% of global primary production disrupted; one-third of Middle East capacity lost | Severe |
| Sulphur/Sulphuric Acid | Half of seaborne trade disrupted; acid prices doubled | Severe — cascading |
| Copper (SxEw) | >15% of global primary copper at risk; DRC and Chile most exposed | High |
| Nickel (HPAL) | Indonesia highly reliant on Middle East sulphur imports | High |
| Lithium (acid roasting) | >99% of hard-rock processing requires H₂SO₄; acid costs rose from 3% to >11% of cash costs | High |
| Cobalt | By-product of copper (DRC) and nickel HPAL — both affected | Moderate-High |
| Rare Earths | Acid bake-and-leach processing affected; H₂SO₄ rose to >20% of C1 costs | Moderate-High |
| Helium | Qatar (~35% of global supply) disrupted; prices spiked from USD 15 to ~USD 70/m³ | High |
| Fertilizers | Entire production chain (N, P, K) disrupted; China halted phosphate exports | Severe |
| Steel | Iran (11% of semi-finished steel trade) infrastructure damaged | Moderate |
Aluminium: Direct Damage and Supply Crisis
The Middle East accounts for 8% of global primary aluminium production, rising to one-fifth when excluding China. During the conflict:
- Aluminium Bahrain (Alba) — the world’s largest smelter outside China (1.6 Mt capacity) — operated at 30% capacity in April 2026 after declaring force majeure and shutting three smelting lines (19% of capacity)
- Qatalum (Qatar, 0.65 Mt capacity) — operating at 60% capacity due to gas supply disruptions
- Emirates Global Aluminium’s Al Taweelah — halted operations after direct strike damage to power facilities (high-purity aluminium crucial for aerospace)
- Restarting smelters after shutdown can take 6-12 months
Exports from the region before the conflict accounted for >10% of total aluminium supply for the EU, Japan, Korea, and Mexico, and ~20% for the US. Aluminium prices reached a four-year high of nearly USD 3,700 per tonne in April 2026, with the Rotterdam premium up 60%.
Sulphur and Sulphuric Acid: The Cascading Crisis
The sulphur disruption is the most far-reaching impact. Around half of global seaborne sulphur trade passes through the Strait of Hormuz, while Gulf countries and Iran account for a quarter of global supply. China is particularly exposed (55% of its 2025 sulphur imports originated in the Middle East).
- Sulphuric acid prices doubled from USD 144/tonne (Feb 2026) to USD 283/tonne (Apr 2026)
- China halted sulphuric acid exports from May 2026 until end-2026, affecting almost a quarter of ex-China acid needs
- In 2025, China exported 4.7 Mt of sulphuric acid; Chile and Indonesia imported half of the total
Table 9: Sulphuric Acid Exposure by Sector
| Sector | Exposure | Risk Level |
|---|---|---|
| Copper (SxEw leaching) | ~15% of global primary copper; DRC 1.5 Mt, Chile 1.2 Mt | DRC: 45% of production; Chile: 20% |
| Nickel (HPAL) | ~9 tonnes sulphur per tonne contained nickel; 80% price increase = +USD 1.7/kg Ni | Some HPAL facilities cutting output |
| Lithium (hard-rock) | >99% of processing requires acid roasting; acid costs = 3% → 11%+ of cash costs | Major cost pressure |
| Rare Earths (acid bake) | Acid costs rose from 5% to >20% of C1 costs | Significant |
| LFP Batteries (phosphoric acid) | Purified phosphoric acid +30% in Q1 2026 | Added price pressure |
| Fertilizers (phosphate) | China halted phosphate exports Dec 2025 – Aug 2026 | Philippines, Kenya, Myanmar most vulnerable |
2.6 Investment Trends: Capital Spending Diverges
After several years of rapid growth, critical mineral investment fell 9% year-on-year in 2025 — the first substantial decline since 2020. However, the decline was highly uneven across commodities.
Table 10: Capital Expenditure by Company Type, 2024-2025
| Company Type | Capex Change | Revenue Change | EBIT Margin | FCF Margin |
|---|---|---|---|---|
| Copper-focused | +8% | +10% | 17% → 21% | 5% → 7% |
| Diversified Majors | -4% (modest) | +4% | Broadly stable | Broadly stable |
| Battery Metals | >-20% (largest decline in over a decade) | Slight recovery | Declined slightly | Negative (improving) |
| └ Lithium specialists | ~-40% | — | — | — |
Exploration spending fell over 10% in 2025, with stark commodity divergence:
- Copper: Broadly steady (remains the main exploration focus)
- Lithium and Nickel: Both dropped ~40%
- By region: Australia and US each ~-25%; Asia Pacific +20%
Table 11: M&A Activity — Completed Transactions (2021-2025)
| Year | Total M&A Value | Dominant Commodity | Key Transaction |
|---|---|---|---|
| 2021 | ~USD 6B | Copper | — |
| 2022 | ~USD 12B | Copper, Lithium | — |
| 2023 | ~USD 17B | Lithium, Copper | — |
| 2024 | ~USD 8B | Copper | — |
| 2025 | ~USD 18B | Copper, Lithium | Rio Tinto-Arcadium Lithium (USD 6.3B) |
Copper M&A doubled in 2025, driven by consolidation and competition for high-quality resources, while battery metal M&A remained subdued beyond the Rio Tinto-Arcadium transaction. Financial investors and majors were the most active buyer types, targeting copper assets.
Table 12: Venture Capital in Critical Minerals Technology, 2015-2025
| Metric | 2023 | 2024 | 2025 |
|---|---|---|---|
| Total VC Funding | ~USD 3.5B | ~USD 1.4B | ~USD 2.0B |
| Share of Energy Tech VC | ~8% | ~4% | ~5% |
| Top Category | Lithium extraction, Battery recycling | Lithium extraction | Data-led exploration, DLE |
| # Start-ups Receiving First Funding | ~35 | ~40 | ~40 |
| Average First-Round Size | ~USD 20M | ~USD 15M | ~USD 12M |
Key observations:
- KoBold Metals (US-based data-led exploration) alone accounted for one-third of total 2025 funding
- Only 3 post-2020 start-ups (Cyclic Materials, Vulcan Elements, Genomines) have raised >USD 40M
- Just 3 start-ups (Redwood Materials, KoBold Metals, Ascend Elements) account for 50% of all funding since 2015
- Critical minerals VC runs counter to the decline in energy tech VC generally
Public Finance Announcements
Government financing commitments for critical minerals reached approximately USD 65 billion in 2025, over four times higher than 2023.
Table 13: Major Public Financing Commitments in 2025
| Country/Entity | Commitment | Instrument |
|---|---|---|
| United States | >USD 7B (direct appropriations) + USD 250B (loan guarantee authority) | One Big Beautiful Bill Act |
| Canada | USD 1.4B (Sovereign Fund) + USD 1.1B (First and Last Mile Fund) | Equity funds |
| India | USD 3B | National Critical Minerals Mission |
| Brazil | USD 1B | BNDES/Finep processing fund |
| Australia | USD 690M (2026 expansion) | Critical Minerals Facility |
| Korea | USD 163M (2025 addition) | Supply Chain Stabilisation Fund |
| EU | USD 3.4B | RESourceEU Action Plan |
China’s total financing dwarfs these figures: an estimated USD 120 billion in outbound mining investment from 2023 to 2025, plus ~USD 24 billion in 363 port projects (2001-2025), ~50% serving energy and mineral supply chains.
2.7 Latest Policy Developments
Table 14: Key Policy Developments in 2025-2026
| Policy Area | Key Actions |
|---|---|
| Critical Minerals Lists | US expanded from 50 to 60 (added copper, uranium, lead); UK added “growth minerals” tier; South Africa revised for industrialization; New Zealand released first list (37 minerals) |
| National Strategies | New Zealand: Minerals Strategy to 2040 (double exports to USD 1.69B by 2035); EU: 47 strategic projects; UK: Vision 2035 (≤60% from single supplier); Chile: National Critical Minerals Strategy; ASEAN: Minerals Development Vision 2045 |
| International Partnerships | US: >20 MOUs (including DRC with priority access); Quad Critical Minerals Initiative Framework (USD 20B mobilization); G7 Critical Minerals Action Plan (rare earth target: <60% from single non-G7 supplier by 2030) |
| Strategic Reserves | US: Project Vault (USD 12B, public-private); Australia: Critical Minerals Strategic Reserve (AUD 1B transactions); DRC: Strategic reserve for cobalt, coltan, germanium |
| Revenue Capture | Indonesia: Revised HPM formula (embedding cobalt value); Philippines: Enhanced Fiscal Regime for mining; DRC: Cobalt export quota + strategic reserve |
| Traceability | G7 Roadmap for interoperable digital credentials; India: Traceability system under National Critical Mineral Mission; Zambia: Integrated Mining Information System; Indonesia: SIMBARA expansion to cobalt |
The gap between commitments and disbursements remains considerable. Many instruments (sovereign funds, loan guarantees, blended finance vehicles) were still in design or early operationalization at end-2025. As the IEA noted: “The central question for markets is not merely the amount of public finance announced, but how, when and where financing will be deployed.”
2.8 Sustainability Performance Tracking
ESG-related risks continue to pose material threats to supply chains in 2025:
Table 15: Sustainability-Related Supply Disruptions in 2025
| Category | Examples | Impact |
|---|---|---|
| Regulatory Non-Compliance | Mali: 90+ exploration permits revoked; Ghana: 270+ small-scale licenses revoked; Indonesia: 190 coal/mineral permits suspended | Immediate supply removal |
| Labour Issues | Workplace fatalities in Chile, Indonesia, Kazakhstan; CMOC Tenke Fungurume strike (DRC, Jun 2026) | Temporary production halts |
| Climate Events | Australia: excessive rainfall disrupted copper; Chile: water scarcity; Canada: forest fires halted Hudbay Snow Lake operations | Production cuts, delays |
| Social Opposition | Resolution Copper permits delayed (US); 4 nickel permits revoked in Raja Ampat (Indonesia) over environmental violations | Multi-year delays |
| Investor Divestment | Norway’s sovereign fund divested from Eramet over PT Weda Bay Nickel environmental/rights concerns (Sep 2025) | Financing risk |





No comments yet