

Executive Summary
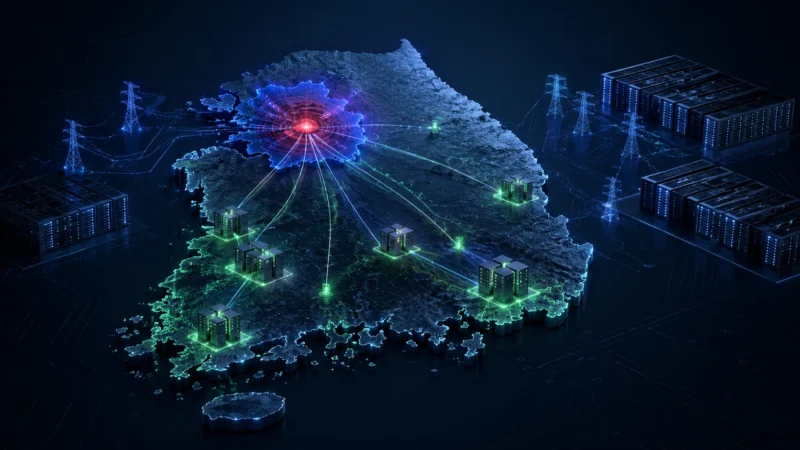
Korea’s data center market has experienced an unprecedented boom over the past five years, with domestic and international asset managers and global private equity funds undertaking large-scale projects across Greater Seoul. Several major transactions have been completed, a robust deal pipeline is forming, and data centers are now firmly established as a core alternative asset class.
However, 2026 marks a critical inflection point. Secured land and grid power availability in Greater Seoul have reached practical limits, triggering a structural supply cliff. The sustainability of AI workload demand and exit structures are being questioned. CBRE’s report cross-analyzes global demand structures with Korea’s supply constraints, outlines entry requirements by potential buyer type, and charts capital circulation pathways — providing solutions for developers, institutional investors, and capital providers seeking viable exit routes.
Table 0: Korea Data Center Market at a Glance (2026)
| Metric | Data Point |
|---|---|
| Greater Seoul Total Supply (2028F) | 1,450+ MW IT Load |
| Largest Submarket (2028F) | Southern Zone — 557 MW (29%) |
| Vacancy Rate | Below 5% (all-time low) |
| 2024 Absorption Rate | 99.7% |
| 2025 Absorption Rate | 99.4% |
| Power System Impact Assessment Final Approval Rate | 1.9% (10 / 522 applications) |
| 2019–2025 Rent Growth | +70% (₩140,000 → ₩250,000/kW/month) |
| Global CSP Tenant Share | 53% (~170 MW) |
| Domestic IT Tenant Share | 34% (~110 MW) |
| Investor Price Increase Expectations | 88% |
| Korea AI Patent Registrations per 100K | 14.31 (Ranked #1 Globally) |
| Korea Major AI Models Released | 8 (Ranked #3 Globally) |
Part 1: Global AI Trends and the U.S. Precedent Market
1.1 The AI-Fueled Structural Surge in Global Data Center Power Demand
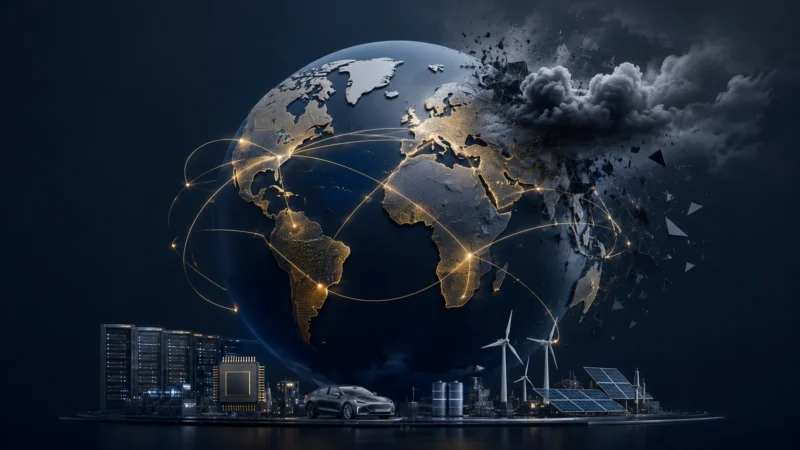
The launch of ChatGPT in November 2022 triggered a structural paradigm shift toward high-performance computing infrastructure. The proliferation of generative AI has driven hyperscale demand for Large Language Model (LLM) training and inference, and the rise in AI workloads — unfolding much faster than the cloud transition era — is driving exponential growth in global power demand.
Table 1: Global Data Center Power Consumption Trends and Outlook (2015–2030F)
| Year | US (Excl. AI) | US (AI) | Rest of World (Excl. AI) | Rest of World (AI) | Total (~TWh) |
|---|---|---|---|---|---|
| 2015 | — | — | — | — | ~200 |
| 2020 | — | — | — | — | ~300 |
| 2022 | — | — | — | — | ~400 |
| 2025 | — | — | — | — | ~700 |
| 2030F | — | — | — | — | 1,100+ |
Note: Exact regional breakdowns are sourced from CBRE’s Figure 1 chart (Goldman Sachs data). Total consumption projected to surge more than 5x from 2015 levels.
The share of AI within total workloads is estimated to expand steeply from less than 3% prior to 2023 to 13% in 2025 and 29% by 2030, indicating that a significant portion of future power growth will be allocated to AI operations.
This decentralized global demand trend is projected to create new opportunities for major Asia Pacific hub markets, including Korea, as global big tech companies diversify beyond U.S. data center locations.
1.2 Big Four Tech CapEx: Structural, Cycle-Independent Demand
The acceleration of generative AI is directly translating into a surge in capital expenditure by the four largest global tech companies — Microsoft, Meta, Google, and Amazon — structurally supporting data center demand.
Table 2: U.S. Big 4 Combined CapEx Spending (2016–2027F)
| Year | Combined CapEx (USD Billion) | Key Milestone |
|---|---|---|
| 2016–2021 | ~100–150 (annual, approximate) | Pre-AI era baseline |
| 2022 | ~180 | ChatGPT launch (November 2022) |
| 2024 | ~200 | Steady AI build-out |
| 2025 | ~330 | Sharp acceleration |
| 2026 | ~610 | Record investment |
| 2027F (Min) | ~800 | Conservative estimate |
| 2027F (Max) | ~1,100 | Upper-bound estimate |
This surge in capital spending is not a simple cyclical investment expansion but rather a structural increase in expenditure aimed at advancing generative AI services and expanding hyperscale infrastructure. Competition among major tech companies to preemptively secure data center capacity is expected to remain intense.
1.3 The AI Penetration Gap: Early-Stage Demand Evidence
Despite significant capital deployment, actual industrial penetration of AI has been slower than theoretical potential suggests. Recent labor market analysis by Anthropic (March 2026) found a significant gap between “theoretical coverage” and “actual coverage” across all occupations.
Table 3: AI Penetration Gap — Theory vs. Reality (Anthropic Analysis)
| Occupation Category | Theoretical Coverage | Actual Coverage | Gap Assessment |
|---|---|---|---|
| Management | High | High | Near convergence |
| Business & Finance | High | High | Near convergence |
| IT & Mathematics | High | High | Near convergence |
| Architecture & Engineering | High | Moderate | Significant gap |
| Natural & Social Sciences | High | Moderate | Significant gap |
| Healthcare Practitioners | Moderate | Low | Structural gap |
| Construction | Moderate | Minimal | Structural gap |
| Production | Moderate | Minimal | Structural gap |
| Transportation | Low | Minimal | Structural gap |
| Food Service | Low | Minimal | Structural gap |
The gap appears closer to a typical time lag seen in the early stages of a paradigm shift rather than a technological limitation. Current large-scale investment represents an infrastructure-building phase to preempt the future full-scale penetration phase.
1.4 From CSP Monopoly to Multi-Layered Demand: Neoclouds Emerge
Starting in 2024, Neocloud providers — offering GPU-as-a-Service as their core business — began to achieve global prominence. These providers are rapidly establishing themselves as major tenants by professionally absorbing high-density AI computing demand that traditional hyperscalers struggle to accommodate.
Table 4: Evolution of Data Center Demand Drivers
| Era | Demand Structure | Key Tenants |
|---|---|---|
| Pre-2024 (Past) | Single Demand Structure | Global CSPs (AWS, Microsoft Azure, Google Cloud) |
| 2024–2025 (Present) | Dual Demand Structure | Global CSPs + Proprietary IT (in-house infrastructure internalization) |
| 2026+ (Emerging) | Multi-Layered Demand | Global CSPs + Proprietary IT + Neocloud Providers |
Key Neocloud Players:
| Region | Companies |
|---|---|
| Global | Crusoe, CoreWeave, Lambda, Nebius |
| Asia Pacific | Yotta, E2E Networks, Neysa AI, Firmus, Sharon AI, Sustainable Metal Cloud |
Major Neocloud firms are expanding beyond the U.S. into Asia Pacific, reportedly considering Korea alongside Singapore, Japan, and India as key target markets.
1.5 U.S. Market: Pre-Leasing at 2x Net Absorption
Data center construction in the U.S. skyrocketed more than 13-fold over five years, yet demand continues to outpace supply expansion dramatically.
Table 5: U.S. Data Center Supply and Absorption Dynamics (Major Markets)
| Year | Net Absorption (MW) | Pre-Leasing (MW) | Under Construction (MW) |
|---|---|---|---|
| 2020 | — | — | 458 |
| 2021 | — | — | ~1,200 |
| 2022 | — | — | ~2,000 |
| 2023 | — | — | ~3,500 |
| 2024 | — | — | ~4,800 |
| 2025 | 2,498 | 4,800 | 5,994 |
As of 2025, pre-leased volume (4,800 MW) reached nearly twice net absorption completed post-construction (2,498 MW), reflecting intense competition among big tech players to secure power and space prior to completion. Excluding pre-leased volume, actual available supply stands at only about 20% of the pipeline under construction.
1.6 U.S. Vacancy and Rental Trends
Table 6: U.S. Data Center Vacancy Rates by Major Market (2025)
| Market | Vacancy Rate |
|---|---|
| New York Metro | 7.5% |
| Silicon Valley | 4.5% |
| Dallas-Fort Worth | ~3.0% |
| Atlanta | ~2.5% |
| Chicago | ~2.0% |
| Phoenix | ~1.5% |
| Northern Virginia | ~1.0% |
| Hillsboro, Oregon | ~0.5% |
| Overall Average | 1.4% (Record Low) |
Table 7: U.S. Data Center Average Rental Growth (250–500kW Range, 2015–2025)
| Year | Average Rent (USD) | YoY Change |
|---|---|---|
| 2015–2021 | ~130–145 | -6% to +1% (Stagnation) |
| 2022 | ~150 | +5% (AI inflection) |
| 2023 | ~172 | +15% |
| 2024 | ~205 | +19% |
| 2025 | ~230 | +12% (Estimate, double-digit sustained) |
1.7 AI Workload Shift: Inference to Become Dominant by 2027
McKinsey data (December 2025) shows the share of inference within total AI demand is set to expand from 26% in 2025 to 42% by 2030. Unlike training infrastructure centered in outer areas with low power costs, inference workloads for real-time services prioritize physical proximity to users and latency management.
Table 8: AI Workload Composition Shift (2025–2030F)
| Workload Type | 2025 | 2026 | 2027F | 2028F | 2029F | 2030F |
|---|---|---|---|---|---|---|
| Non-AI Workload | ~60% | ~55% | ~50% | ~45% | ~40% | ~35% |
| AI Training | ~14% | ~18% | ~20% | ~21% | ~22% | ~23% |
| AI Inference | 26% | ~27% | ~30% | ~34% | ~38% | 42% |
This inference-driven demand shift serves as a new growth engine for major Asia Pacific hubs, including Korea — where stable IT infrastructure and high user accessibility make urban-proximate data centers particularly valuable.
1.8 U.S. Grid Constraints and Social Pushback
The inability to expand data center supply in the U.S. stems from structural grid limitations and subsequent cost escalations, which have triggered intense social and political resistance.
Table 9: U.S. Grid Constraints and Social Opposition — Key Indicators
| Indicator | Data |
|---|---|
| Indiana Average Household Electricity Rate Increase (Apr 2024–Apr 2025) | +17.5% (Largest increase in 20 years) |
| Dominion (Virginia) 2026 Residential Rate Hike Filing | +14% |
| PJM Capacity Market Price Increase (5-Year) | +500% ($14.7B increase, 60% attributable to DCs) |
| Data Center Projects Blocked or Delayed | 36 projects (~$162B / ₩220T total value) |
| Cancelled DC Projects (2024 → 2025) | 6 → 25 |
| Active DC Opposition Groups | 188 groups across 40 states |
| States with Moratorium Bills | 12 (NY, NJ, PA, GA, SC, VA, OK, etc.) — Bipartisan trend |
| Maine LD 307 | First U.S. DC moratorium (20MW+), passed both chambers, Governor’s veto overturned |
| Public Opposition to AI DCs Nearby | 65% oppose vs. 24% support (Top reason: electricity rates, 72%) |
Part 2: Korea Data Center Market Analysis
2.1 From Telecom Self-Build to Global Capital-Led Growth
Table 10: Korea Data Center Market Growth Stages
| Phase | Period | Primary Drivers | Characteristics |
|---|---|---|---|
| Phase 1 | Pre-2020 | Domestic telecom operators (KT, SK Broadband, LG U+) | Self-use centers; limited commercial supply |
| Phase 2 | 2020–2021 | Global CSP entries (AWS, Microsoft Azure, Google Cloud) | Hyperscale requirements introduced |
| Phase 3 | 2021–Present | Asset managers + global specialized operators | 20% CAGR; hyperscale-level supply expansion |
Table 11: Greater Seoul Cumulative Data Center Supply by Region (MW, IT Load Capacity)
| Year | Central | North | South | West | Cumulative Total |
|---|---|---|---|---|---|
| 2020 | ~120 | — | ~40 | ~20 | ~180 |
| 2021 | ~150 | — | ~60 | ~30 | ~240 |
| 2022 | ~190 | ~20 | ~100 | ~50 | ~360 |
| 2023 | ~240 | ~40 | ~160 | ~80 | ~520 |
| 2024 | ~300 | ~60 | ~230 | ~110 | ~700 |
| 2025 | ~350 | ~80 | ~300 | ~150 | ~880 |
| 2026F | ~380 | ~100 | ~400 | ~200 | ~1,080 |
| 2027F | ~400 | ~120 | ~480 | ~250 | ~1,250 |
| 2028F | 417 | ~130 | 557 | 262 | ~1,450 |
By 2028, the Southern zone is projected to surpass the traditional Central hub to become the largest submarket in Greater Seoul.
2.2 Power Availability Dictates Location Decisions
The geographic expansion of Greater Seoul’s data center market is driven not by limited sites in Seoul or shifting preferences, but by a strict power-seeking shift. Post-2026 supply is concentrated in high-density clusters in the Western and Southern zones.
Table 12: Greater Seoul Data Center Submarket Zones
| Zone | Key Districts | 2028F Share | Characteristics |
|---|---|---|---|
| Central | Yongsan, Gangnam, Gasan | 29% | Traditional hub; highest urban accessibility; power severely constrained |
| South | Seongnam, Yongin, Anyang, Ansan, Pangyo, Bundang, Gwacheon | 38% | Emerging as largest submarket; strong infrastructure base |
| West | Incheon, Bucheon, Gimpo | 18% | Independent core cluster; power access advantage |
| North | Sangam, Goyang | ~9% | Limited development; comparatively lower activity |
2.3 The Distributed Energy Act: The Structural Supply Gatekeeper
The Distributed Energy Promotion Act (enacted 2024) serves as the most significant turning point and structural risk reshaping Korea’s data center development landscape. Since its introduction, KEPCO’s actual grid supply capacity has already reached its limit.
Table 13: Power System Impact Assessment — Cumulative Applications (As of March 2026)
| Stage | Applications | Capacity (MW) | Approval Rate |
|---|---|---|---|
| Initial Technical Review — Total Submitted | 522 cases | 33,592 MW | — |
| Technical Review: Supply Feasible | 243 cases | 15,542 MW | 46.6% (by case) / 46.3% (by MW) |
| Technical Review: Supply Infeasible | 279 cases | 18,050 MW | 53.4% (by case) / 53.7% (by MW) |
Table 14: Final Review and Approval (As of March 2026)
| Stage | Cases | Capacity (MW) | Pass Rate |
|---|---|---|---|
| Passed Initial Review | 243 | 15,542 MW | — |
| Progressed to Final Evaluation | 24 | ~1,500 MW | 9.9% (of initial pass) |
| Final Supply Approval | 10 | 1,010 MW | 1.9% (of total applications) / 4.1% (of initial pass) |
A final approval rate of just 1.9% demonstrates that passing the initial technical review by no means guarantees actual power procurement. Having completed final approval implies an exclusive status — overcoming a 1.9% probability.
2.4 KEPCO Infrastructure Plan: Limited Relief for Private Data Centers
Table 15: KEPCO 11th Long-Term Transmission and Substation Plan for Greater Seoul (through 2038)
| Substation Type | New Installations Planned | Total Capacity Addition (MVA) |
|---|---|---|
| 345 kV Substations | 41 | ~36,000 |
| 154 kV Substations | 84 | ~30,200 |
| Total | 125 substations | 66,200 MVA |
However, a significant portion of planned capacity is pre-allocated to specialized high-tech industrial complexes (e.g., Yongin Semiconductor Cluster) and large-scale residential districts. Available capacity for private commercial data centers is practically negligible. Furthermore, supply is heavily front-loaded through 2028, with additions slowing sharply and stagnating from 2029 onward.
Table 16: Annual Supply Timeline for New Substations
| Period | 345kV Annual Supply (MVA) | 154kV Annual Supply (MVA) | Key Observation |
|---|---|---|---|
| 2026–2028 | ~8,000–9,000 | ~1,500–2,500 | Concentrated supply period |
| 2029–2038 | Sharply declining | ~1,000–1,500 annually | Slowdown and stagnation |
2.5 HVDC: The Only Structural Solution — But Years Away
Table 17: Greater Seoul HVDC Transmission Lines (KEPCO 11th Plan)
| # | Project Name | Length | Expected Completion | Connected Region |
|---|---|---|---|---|
| 1 | Donghaean #1 C/S – Singapyeong C/S | 230 km | October 2026 | Yeongdong → Greater Seoul |
| 2 | Donghaean #2 C/S – Dongseoul C/S | 280 km | December 2027 | Yeongdong → Greater Seoul |
| 3 | Saemangeum C/S – Seohwaseong C/S | 220 km | December 2030 | Honam → Greater Seoul |
| 4 | Saemangeum C/S – Yeongheung Thermal C/S | 210 km | December 2038 | Honam → Jungbu |
| 5 | Sinhaenam C/S – Seoincheon Combined C/S | 350 km | December 2038 | Honam → Greater Seoul |
Even with the initial line completing at the end of 2026, new data center facilities will not practically utilize this power until at least 2030 given typical development lead times of three to five years.
2.6 Supply-Demand Dynamics: Near-Perfect Absorption
Table 18: Greater Seoul Data Center Annual Supply and Absorption (2024–2028F)
| Year | Total Supply (MW) | Leased/Pre-Leased (MW) | Under Negotiation (MW) | Vacant (MW) | Leased/Pre-Leased Share |
|---|---|---|---|---|---|
| 2024 | ~130 | ~130 | — | ~0 | 99.7% |
| 2025 | ~180 | ~179 | — | ~1 | 99.4% |
| 2026F | ~200 | ~111 | ~89 | — | 55.5%* |
| 2027F | ~170 | ~27 (pre-leased) | Under negotiation | — | 16.0% (pre-leased already) |
| 2028F | ~200 | ~47 (pre-leased) | Under negotiation | — | 23.5% (pre-leased already) |
*The 55.5% figure for 2026 reflects a transitional phase where completed assets are fully absorbed while under-construction assets are under active lease negotiation. When accounting for pre-completion pipelines, effective demand satisfaction remains consistent with prior stabilized years.
The pre-leasing pattern for 2027 (16.0%) and 2028 (23.5%) is unprecedented in the Greater Seoul market, signaling a critical shift where occupiers proactively secure capacity long before construction completion.
2.7 Tenant Composition: Multi-Layered Demand Structure
Table 19: Greater Seoul Data Center Tenant Composition (2024–2025 Leasing Cases)
| Tenant Category | Capacity (MW) | Share | Key Examples |
|---|---|---|---|
| Global CSPs | ~170 MW | 53% | Google Cloud, AWS, Microsoft Azure |
| Domestic IT Companies | ~110 MW | 34% | NHN, Kakao, NAVER, Coupang |
| Other | ~39 MW | 12% | SI Companies, Retail End Users |
| Emerging Demand Pool | — | — | Chinese CSPs (Alibaba, Tencent), Neoclouds |
2.8 Three Emerging Demand Segments
Table 20: Emerging Demand Pools and Requirements
| Demand Segment | Key Drivers | Location Requirements | Status |
|---|---|---|---|
| ① Financial Sector AI Adoption | Regulatory constraints on offshore data processing; KB, Shinhan, Hana, NH accelerating digital transition | Greater Seoul proximity for sensitive data | Transitioning to dedicated colocation |
| ② Public/Sovereign AI | Security and real-time responsiveness requirements; government ministries and public institutions concentrated in Seoul | Greater Seoul (some decentralization to Haenam, Jangseong) | National AI computing partially decentralized |
| ③ Corporate AX Transformation | Shift from public cloud to dedicated colocation for cost optimization and inference performance (major conglomerates) | Greater Seoul for low latency | Exploration phase; limited actual transitions |
2.9 Korea’s AI Ecosystem: World-Leading Fundamentals
Table 21: Korea’s Global AI Rankings (Stanford HAI AI Index 2026)
| Pillar | Korea’s Ranking | Key Metric | Comparison |
|---|---|---|---|
| AI Adoption | #1 | +6.4pp deployment expansion (Q1 2026) | Fastest tech absorption speed globally |
| AI Development | #1 | 14.31 AI patents per 100,000 people | US: 4.68; China: 6.95 |
| AI Production | #3 | 8 major AI models released | US: #1; China: #2 |
Korea is uniquely positioned as the only nation ranking at the global top across adoption speed, technological development, and model production — a powerful trifecta underpinning structural demand for domestic data center infrastructure.
2.10 Rapid Rent Growth: Pricing in Scarcity
Table 22: Greater Seoul Data Center Floor Space Rent Trends (1MW+, 2019–2025)
| Year | Average Rent (₩10,000/kW/Month) | YoY Growth | Cumulative vs. 2019 |
|---|---|---|---|
| 2019 | ~14.0 | — | Baseline |
| 2020 | ~14.5 | ~+4% | +4% |
| 2021 | ~15.0 | ~+3% | +7% |
| 2022 | ~16.0 | ~+7% | +14% |
| 2023 | ~19.0 | ~+19% | +36% |
| 2024 | ~22.0 | ~+16% | +57% |
| 2025 | ~25.0 | ~+14% | +79% |
Compound Annual Growth Rates:
- 2019–2022 CAGR: +8.7%
- 2022–2025 CAGR: +10.1% (post-ChatGPT acceleration)
- 2019–2025 CAGR: +9.4%
A prevailing market rate of approximately ₩250,000/kW has now formed broadly across major Greater Seoul submarkets, including the Central and Southern zones. However, meaningful variations exist based on location, asset specifications, and contract scale.
2.11 U.S. vs. Korea: Parallel Supply-Demand Imbalance
Table 23: U.S. vs. Korea Data Center Market Comparison
| Dimension | United States | Korea (Greater Seoul) |
|---|---|---|
| Demand Base | $1.1T Big 4 CapEx (2027F); low AI penetration (early-stage evidence) | World-class AI ecosystem (#1 adoption, #1 patents, #3 model production) |
| Vacancy Rate | 1.4% (record low) | Below 5% (all-time low) |
| Absorption | Pre-leasing at 2x net absorption | 99.4–99.7% immediate absorption (2024–2025) |
| Rental Growth | +19% (2024), double-digit sustained | +70% vs. 2019; CAGR +10.1% (2022–2025) |
| Supply Constraints | Grid overload + social opposition (25 cancellations, 188 opposition groups, moratorium bills in 12 states) | 1.9% final power approval rate; grid saturation materialized |
| Grid Solution Timeline | Uncertain; state-level moratoriums expanding | HVDC from 2026, practical use post-2030 |



No comments yet