

Executive Summary
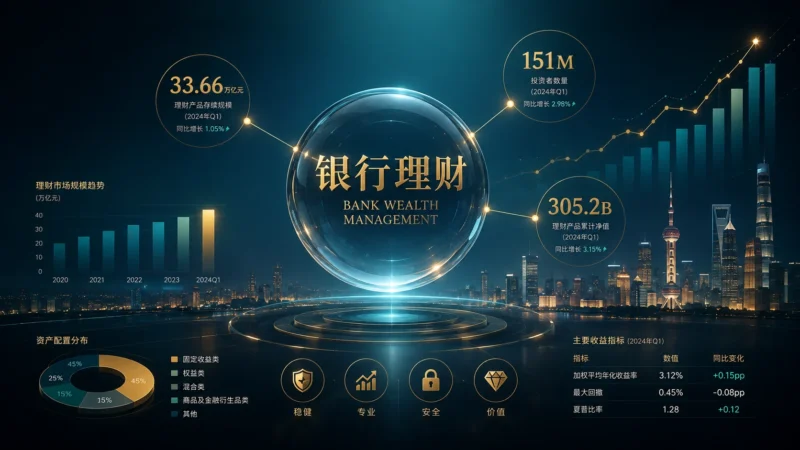
China’s banking wealth management (WM) market demonstrated steady and resilient growth in the first half of 2026, with outstanding products reaching RMB 33.66 trillion (USD ~4.6 trillion), up 1.11% from the beginning of the year and 9.75% year-on-year. The market added 151 million investor accounts (+5.59%), generated RMB 305.2 billion in cumulative investment returns, and channeled approximately RMB 21 trillion toward the real economy through bond investments, non-standard credit assets, and equity holdings.
2026 marked a pivotal year: the 15th Five-Year Plan formally enshrined “accelerating the building of a financial powerhouse” into national strategy, while the National Financial Regulatory Administration (NFRA) released the landmark Wealth Management Company Regulatory Rating Interim Measures (March 2026) and the Administrative Measures for Information Disclosure of Asset Management Products of Banking and Insurance Institutions (December 2025, effective September 2026) — collectively reshaping the industry’s regulatory architecture.
Chapter 1: Market Overview — Key Metrics at a Glance
1.1 Headline Figures
| Metric | Value (End-Jun 2026) | Change from Beginning of Year | YoY Change |
|---|---|---|---|
| Outstanding Products | 51,200 | +10.58% | +22.49% |
| Outstanding Balance | RMB 33.66 tn | +1.11% | +9.75% |
| New Products Issued (H1) | 18,200 | — | — |
| Funds Raised (H1) | RMB 39.21 tn | — | — |
| Total Investors | 151 million | +5.59% | — |
| Investment Returns Generated (H1) | RMB 305.2 bn | — | — |
| Active Institutions | 185 (153 banks + 32 WM cos) | — | — |
| New-Issuing Institutions (H1) | 132 (32 WM cos + 100 banks) | — | Banks: -32 YoY |
1.2 Historical Trajectory of Outstanding Balance (RMB Trillion)
| Period | Outstanding Balance | Outstanding Products | Quarterly Change (Balance) |
|---|---|---|---|
| 2024.06 | — | — | — |
| 2024.09 | — | — | — |
| 2024.12 | — | — | — |
| 2025.03 | — | — | — |
| 2025.06 | ~30.66 tn | — | — |
| 2025.09 | — | — | — |
| 2025.12 | ~33.29 tn | 46,300 | — |
| 2026.03 | — | — | — |
| 2026.06 | 33.66 tn | 51,200 | +1.11% from 2025.12 |
Note: The outstanding balance reached 33.66 trillion yuan as of end-June 2026. The above trajectory is reconstructed from the report’s year-end 2025 base and YoY growth rates.
Chapter 2: Market Structure — Wealth Management Companies Dominate
2.1 Institutional Breakdown
| Institution Type | Number of Institutions | Outstanding Products | Outstanding Balance (RMB tn) | YoY Balance Change | Market Share |
|---|---|---|---|---|---|
| Total Market | 185 | 51,200 | 33.66 | +9.75% | 100% |
| Bank Institutions | 153 | 12,100 | 2.48 | -22.26% | 7.37% |
| Wealth Management Companies | 32 | 39,100 | 31.18 | +13.46% | 92.63% |
The structural transformation of China’s wealth management market is effectively complete: wealth management subsidiaries now account for 92.63% of total outstanding balance, up from already-dominant levels. The remaining 153 banks hold only 7.37% of the market and continue to shrink (-22.26% YoY), reflecting the regulatory-driven transition toward specialized, independently-managed wealth management entities.
2.2 The 32 Wealth Management Companies
As of June 2026, there were 32 established wealth management companies in China, including one new entrant — Zhe Yin Wealth Management (浙银理财), which commenced operations in January 2026 with registered capital of RMB 2 billion, based in Hangzhou.
Table: Wealth Management Companies — Key Characteristics
| Category | Count | Examples | Notes |
|---|---|---|---|
| Large State-Owned Bank Subsidiaries | 6 | ICBC WM (160 bn capital), CCB WM (150 bn), ABC WM (120 bn), BOC WM (100 bn), BoCom WM (80 bn), PSBC WM (80 bn) | Highest registered capital |
| Joint-Stock Bank Subsidiaries | 12 | CMB WM (55.56 bn), CIB WM (100 bn), CITIC WM (50 bn), SPDB WM (50 bn), CEB WM (50 bn), Ping An WM (50 bn), Minsheng WM (50 bn), Huaxia WM (30 bn), Bohai WM (20 bn), Hengfeng WM (20 bn), GF WM (50 bn), Zheshang WM (20 bn) | Core market makers |
| City Commercial Bank Subsidiaries | 8 | Bank of Nanjing WM, Bank of Ningbo WM, Bank of Hangzhou WM, Bank of Jiangsu WM (30 bn), Bank of Shanghai WM (30 bn), Bank of Beijing WM (20 bn), Bank of Qingdao WM (10 bn), Hui Shang WM (20 bn) | Regional champions |
| Rural Commercial Bank Subsidiary | 1 | Chongqing Rural Commercial Bank WM (20 bn) | Only rural bank WM subsidiary |
| Foreign JV / Wholly Foreign-Owned | 5 | BNP Paribas ABC WM (10 bn), BlackRock CCB WM (14 bn), Goldman Sachs ICBC WM (13.5 bn), HSBC Qianhai WM (10 bn), Schroders BoCom WM (12 bn) | All based in Shanghai |
Chapter 3: Product Type Structure — Deep Dive
3.1 By Investment Nature
| Investment Type | Bank Balance (RMB tn) | WM Company Balance (RMB tn) | Total Balance (RMB tn) | Market Share | Change from 2025.12 |
|---|---|---|---|---|---|
| Fixed Income | 2.38 | 30.10 | 32.48 | 96.49% | -0.60pp |
| Mixed | 0.04 | 1.03 | 1.07 | 3.18% | +0.57pp |
| Equity | 0.06 | 0.03 | 0.09 | 0.27% | — |
| Commodities & Derivatives | <0.01 | 0.02 | 0.02 | 0.06% | — |
| Total | 2.48 | 31.18 | 33.66 | 100% | — |
Critical Observation: Fixed-income products dominate at 96.49%, but the share has declined slightly (-0.60pp from year-end 2025 and -0.71pp YoY). Mixed-class products gained 0.57pp to reach 3.18%, signaling a subtle but meaningful diversification trend. Equity products remain negligible at 0.27%, reflecting both conservative investor preferences and regulatory caution.
3.2 By Offering Method
| Offering Type | Bank Balance | WM Company Balance | Total Balance | Share |
|---|---|---|---|---|
| Public Offering | 2.43 (97.98%) | 29.36 (94.16%) | 31.79 | 94.44% |
| Private Placement | 0.05 (2.02%) | 1.82 (5.84%) | 1.87 | 5.56% |
| Total | 2.48 | 31.18 | 33.66 | 100% |
3.3 By Operating Mode
| Operating Mode | Bank Balance | WM Company Balance | Total Balance | Share |
|---|---|---|---|---|
| Open-End Products | 1.93 | 24.24 | 26.17 | 77.75% |
| — of which: Cash Management | 0.28 | 6.07 | 6.35 | 24.26% of Open-End |
| Closed-End Products | 0.55 | 6.94 | 7.49 | 22.25% |
| Total | 2.48 | 31.18 | 33.66 | 100% |
Key Trends:
- Open-end product share declining: Down 2.12pp from year-end 2025 and 3.18pp YoY — a notable structural shift toward longer-duration closed-end products
- Cash management products contracting: 6.35 trillion yuan, down 2.22pp from year-end 2025 and 1.53pp YoY as a share of open-end products. This reflects both regulatory guidance away from cash-like products and investor willingness to accept slightly longer durations for higher yields
- Closed-end product maturities extending: New closed-end products in H1 2026 had weighted-average maturities ranging from 344 to 441 days per month, providing long-term stable funding. Products with maturities >1 year accounted for 74.10% of all closed-end products (+3.23pp from year-start)
3.4 By Risk Level
| Risk Level | Bank Balance | WM Company Balance | Total Balance | Share |
|---|---|---|---|---|
| R1 (Low) | 0.22 | 8.07 | 8.29 | 24.63% |
| R2 (Medium-Low) | 2.08 | 21.50 | 23.58 | 70.05% |
| R1 + R2 Subtotal | 2.30 | 29.57 | 31.87 | 94.68% |
| R3 (Medium) | 0.14 | 1.56 | 1.70 | 5.05% |
| R4 (Medium-High) | 0.03 | 0.01 | 0.04 | 0.12% |
| R5 (High) | 0.01 | 0.04 | 0.05 | 0.15% |
| Total | 2.48 | 31.18 | 33.66 | 100% |
A striking 94.68% of all wealth management products are rated R2 or below, underscoring the deeply conservative risk profile of the market. Notably, WM companies hold a significantly higher share in R1 products (25.88%) vs. banks (8.87%), reflecting their large-scale cash management offerings.
Keywords: China wealth management market 2026, China banking wealth management report H1 2026, Chinese bank WMP outstanding balance, China wealth management company ranking, China WMP investor count 2026, China fixed income wealth products, China pension wealth management, China ESG wealth products, China personal pension wealth products, NFRA wealth management regulation, China financial powerhouse 15th Five-Year Plan, China wealth management yield 2026, China WMP asset allocation






No comments yet