

Executive Summary
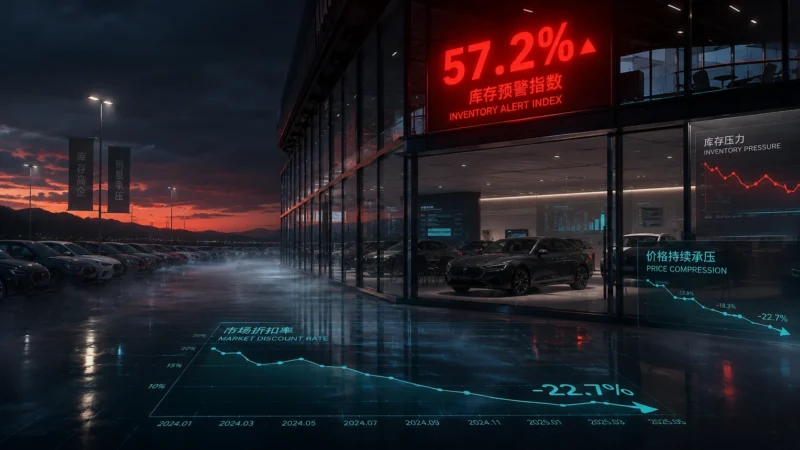
China’s auto retail sector continued to face significant headwinds in June 2026, with the China Automobile Dealers Association (CADA) Vehicle Inventory Alert Index (VIA) registering 57.2% — marking the 18th consecutive month above the 50% boom-bust threshold. While the reading improved 0.7 percentage points from May’s 57.9%, it rose 0.6pp year-over-year from June 2025’s 56.6%, signaling that structural overcapacity and weakening consumer demand remain entrenched challenges for the world’s largest auto market.
The June data reveals a market characterized by deepening consumer hesitation (57.4% of dealers reported worsening wait-and-see sentiment), widespread price compression (47.1% of dealers cut prices, zero reported price increases), and disappointing first-half sales performance (76.9% of dealers failed to meet H1 targets, with 39.8% below 70% completion). Regional disparities are stark, with the Western region index soaring to 61.2% versus just 53.1% in the South. Notably, domestic Chinese brands bucked the trend with a slight improvement, while luxury/import and mainstream joint-venture brands saw their indices decline MoM.
On the policy front, a flurry of government measures — including 40 pilot cities for auto circulation reform, 17 specific measures to boost automotive aftermarket consumption, and real-time vehicle certificate information sharing — signal official recognition of the sector’s distress. However, the CADA cautions that policy transmission takes time and is unlikely to provide immediate relief amid the traditional summer lull.
This article provides a comprehensive, data-rich analysis of the June 2026 VIA, including detailed breakdowns by sub-index, region, brand type, and dealer sentiment indicators. All data tables are self-contained and can serve as a standalone reference for understanding China’s auto retail market dynamics.
Table of Contents
- Headline Index: June 2026 VIA at 57.2%
- Sub-Index Breakdown: Five Dimensions of Dealer Health
- Regional Analysis: West Under Severe Stress
- Brand Type Analysis: Domestic Brands Show Relative Resilience
- Transaction Metrics: Rates, Prices, and Inventory Levels
- Dealer Sentiment: H1 Performance Review and July Outlook
- Policy Landscape: Government Measures and Market Implications
- Historical Trend Analysis (2021–2026)
- Methodology: Understanding the VIA
- Data Summary Tables
- Cover Image Prompt
1. Headline Index: June 2026 VIA at 57.2%
The China Automobile Dealers Association (CADA) released its June 2026 Vehicle Inventory Alert Index (VIA) on the last working day of the month, reporting a headline reading of 57.2% — above the 50% equilibrium line for the 18th consecutive month.
Table 1: Headline VIA – June 2026
| Metric | Value |
|---|---|
| June 2026 VIA | 57.2% |
| Month-over-Month Change | -0.7pp (from 57.9% in May 2026) |
| Year-over-Year Change | +0.6pp (from 56.6% in June 2025) |
| Position vs. 50% Threshold | Above (18 consecutive months) |
| Signal | Market under sustained pressure; inventory risk elevated |
The 57.2% reading, while marginally improved from May, remains firmly in warning territory. The index has now been above the 50% mark continuously since January 2025, underscoring the structural nature of the auto retail market’s challenges rather than a transient cyclical dip.
Table 2: Monthly VIA Trend (January 2025 – June 2026)
| Month | 2025 VIA | 2026 VIA | YoY Change | MoM Change (2026) |
|---|---|---|---|---|
| January | 57.0% | 62.3% | +5.3pp | — |
| February | 54.5% | 56.9% | +2.4pp | -5.4pp |
| March | 52.6% | 54.6% | +2.0pp | -2.3pp |
| April | 55.6% | 59.8% | +4.2pp | +5.2pp |
| May | 57.7% | 57.9% | +0.2pp | -1.9pp |
| June | 56.6% | 57.2% | +0.6pp | -0.7pp |
| July | 59.4% | — | — | — |
| August | 56.2% | — | — | — |
| September | 57.5% | — | — | — |
| October | 62.1% | — | — | — |
| November | 57.9% | — | — | — |
| December | 57.2% | — | — | — |
| 2025 Average | 56.6% | 58.1% (H1 2026) | — | — |
Key Observations:
- 2026 started with exceptional stress: The January 2026 spike to 62.3% — the highest reading in the two-year series — reflected post-holiday inventory accumulation and weak early-year demand
- Q1 recovery was partial and fragile: The index moderated to 54.6% by March but remained above year-ago levels
- April 2026 saw a sharp reversal: The index surged 5.2pp MoM to 59.8%, driven by the post-Beijing Auto Show inventory build and weaker-than-expected spring sales
- May-June cooling is seasonal, not structural: While the 0.7pp MoM decline in June is welcome, the absolute level at 57.2% remains elevated, and the YoY comparison (+0.6pp) confirms deteriorating conditions versus the prior year
- 2026 H1 average of 58.1% compares unfavorably to the 2025 full-year average of 56.6%
2. Sub-Index Breakdown: Five Dimensions of Dealer Health
The VIA is a composite index constructed from five sub-indices that capture different dimensions of dealer operating conditions. June 2026 data reveals a market where inventory and demand pressures are easing slightly but business conditions remain deeply challenged.
Table 3: VIA Sub-Index Performance (May vs. June 2026)
| Sub-Index | May 2026 | June 2026 | MoM Change | Signal |
|---|---|---|---|---|
| Inventory | 50.9% | 43.1% | -7.8pp | Sharp improvement; destocking in progress |
| Market Demand | 41.2% | 36.8% | -4.4pp | Deteriorating; consumer appetite weakening |
| Average Daily Sales | 40.5% | 41.2% | +0.7pp | Marginal recovery; late-month push |
| Employment | 37.2% | 32.8% | -4.4pp | Headcount reduction; cost-cutting |
| Business Conditions | 35.3% | 37.7% | +2.4pp | Slight improvement; still deeply negative |
Interpreting the Five Sub-Indices:
Each sub-index is constructed on the same principle as the headline VIA: readings above 50% indicate expansion/pressure, while readings below 50% indicate contraction/improvement. However, the interpretation differs by sub-index:
- Inventory (43.1%, down 7.8pp MoM): A sharp decline from 50.9% signals that dealers are making real progress in destocking, likely driven by late-month promotional campaigns and manufacturers adjusting wholesale shipments. This is the most positive signal in the June data
- Market Demand (36.8%, down 4.4pp MoM): The deterioration from an already weak 41.2% is concerning. It confirms the CADA’s qualitative finding that consumer wait-and-see sentiment is deepening rather than easing, with price comparison and delayed purchasing becoming the dominant consumer behavior
- Average Daily Sales (41.2%, up 0.7pp MoM): The marginal improvement from 40.5% likely reflects the late-June sales push (semi-annual performance冲刺, Dragon Boat Festival promotions, 618 e-commerce festival), but the absolute level below 50% signals persistent sales weakness
- Employment (32.8%, down 4.4pp MoM): The steepest decline among all sub-indices, reflecting dealer workforce reductions as cost control becomes paramount amid sustained losses and cash flow pressure
- Business Conditions (37.7%, up 2.4pp MoM): A modest improvement from 35.3% but still deep in negative territory. At this level, the vast majority of dealers continue to face deteriorating profitability
3. Regional Analysis: West Under Severe Stress
The CADA divides China into four macro-regions for the VIA survey. June 2026 data shows all regions improving MoM from elevated May levels, but the Western region remains under exceptional pressure.
Table 4: VIA by Region (May vs. June 2026)
| Region | Provinces Covered | May 2026 | June 2026 | MoM Change | Assessment |
|---|---|---|---|---|---|
| National | All China | 57.9% | 57.2% | -0.7pp | Above threshold |
| North (北区) | Beijing, Hebei, Henan, Heilongjiang, Jilin, Liaoning, Inner Mongolia, Shanxi | 58.4% | 55.1% | -3.3pp | Largest MoM improvement |
| East (东区) | Anhui, Jiangsu, Shandong, Shanghai, Tianjin, Zhejiang | 58.4% | 56.8% | -1.6pp | Slightly above national average |
| West (西区) | Gansu, Guizhou, Shaanxi, Sichuan, Xinjiang, Yunnan, Chongqing, Ningxia, Qinghai, Tibet | 66.4% | 61.2% | -5.2pp | Largest decline but still highest absolute level |
| South (南区) | Fujian, Guangdong, Guangxi, Hainan, Hubei, Hunan, Jiangxi | 54.2% | 53.1% | -1.1pp | Best-performing region |
Regional Dynamics:
- Western Region (61.2%): Despite the largest MoM improvement (-5.2pp from a severely distressed 66.4% in May), the Western region remains at critically elevated levels. The 61.2% reading — 8.1pp above the South — reflects the region’s lower economic development level, weaker consumer purchasing power, thinner dealer networks, and greater vulnerability to macroeconomic headwinds. The Western region’s index has been persistently elevated throughout 2025–2026
- Northern Region (55.1%): Posted the best relative improvement (-3.3pp MoM), likely benefiting from seasonal factors including the ramp-up of agricultural and construction activity in northern provinces. At 55.1%, it is now the second-best region after the South
- Eastern Region (56.8%): The economically most developed region — encompassing Shanghai, Jiangsu, Zhejiang, and Shandong — shows moderate stress. While the region benefits from higher income levels and stronger consumer confidence, intense dealer competition and high operating costs temper performance
- Southern Region (53.1%): Consistent with historical patterns, the South — anchored by Guangdong, the largest provincial auto market — is the most resilient region. However, a 53.1% reading still implies that more dealers report deteriorating than improving conditions
Keywords: China auto dealer inventory alert index June 2026, CADA vehicle inventory alert index, China auto market 2026, Chinese car dealer inventory levels, auto dealer sentiment China, China passenger car sales 2026, auto price war China 2026, China auto dealer profitability, car dealer inventory warning index, Chinese auto retail market outlook July 2026, NEV penetration China 2026, auto dealer operating conditions China






No comments yet