

Executive Summary
China’s economy navigated a complex global environment in the second quarter of 2026, delivering 4.3% year-over-year GDP growth (4.7% in H1 2026) amid intensifying geopolitical tensions, hawkish monetary policy signals from major central banks, and a continued divergence between robust external demand and sluggish domestic consumption. The National Institution for Finance and Development (NIFD) at the Chinese Academy of Social Sciences (CASS) paints a picture of an economy undergoing a fundamental structural transformation — one where new quality productive forces are increasingly driving growth, but legacy drags from real estate adjustment, weak household confidence, and fiscal implementation bottlenecks persist.
Globally, the quarter was defined by persistent inflation stickiness (US CPI at 3.5%, Eurozone HICP at 3.2%), synchronized monetary tightening (ECB and BOJ both hiked 25bp), and a remarkable 37.21% surge in Japan’s Nikkei 225. The Federal Reserve held rates steady but signaled that 9 of 18 FOMC members anticipate further hikes before year-end, keeping global financial conditions tight. Against this backdrop, the renminbi appreciated 1.6% against the US dollar — a counter-cyclical strengthening that underscores the resilience of China’s external position.
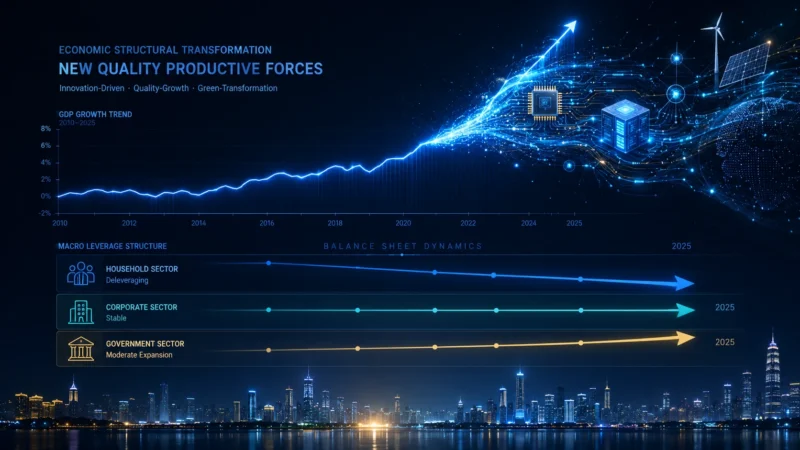
Domestically, China’s macro-financial landscape reveals a clear three-pillar dynamic: supply-side structural upgrading (high-tech manufacturing +13.3%, services contributing 69.4% of GDP growth), demand-side polarization (exports +13.4% vs. retail sales +1.3%), and a deleveraging cycle characterized by “active household deleveraging, passive corporate deleveraging, and mild government leveraging.” The report offers five concrete policy prescriptions spanning fiscal expansion, real estate stabilization, AI industry governance, cross-border risk monitoring, and structural adjustment.
Table of Contents
- Global Macro-Financial Environment
- China GDP Growth and Supply-Side Dynamics
- Demand-Side Analysis: The Three Engines Diverge
- Macro Leverage: Household, Corporate, and Government Balance Sheets
- Fiscal Policy: Implementation Gaps and Efficiency Challenges
- Monetary Policy and Financial Conditions
- Risk Assessment and Policy Recommendations
- Data Summary Tables
- Cover Image Prompt
1. Global Macro-Financial Environment
1.1 United States: Resilient Consumption, AI-Driven Investment Boom
The US economy continued to demonstrate resilience in Q2 2026, though growth momentum showed signs of moderation toward quarter-end.
Table 1: US Key Economic Indicators (Q2 2026)
| Indicator | April | May | June | Q2 Trend |
|---|---|---|---|---|
| Retail Sales (MoM) | +0.7% (revised) | +1.0% (revised) | +0.2% | Q2 YoY: +6.4% |
| Retail Sales ex-Gasoline (MoM) | — | — | +0.7% | Core consumption stable |
| CPI (YoY) | — | 4.2% | 3.5% | -0.7pp decline; easing pressure |
| Core PCE (YoY) | — | 3.4% | — | Well above 2% target |
| Non-Farm Payrolls | -74K revision (Apr+May) | — | +57K | Sharp deceleration |
| Unemployment Rate | — | 4.2% | 4.3% | Labor participation decline |
| Core Capital Goods Orders (MoM) | -0.7% | +1.6% | — | Rebound signal |
| Core Capital Goods Shipments (MoM) | — | +0.3% | Second consecutive growth | Equipment investment improving |
Consumption Story: US retail sales grew at a healthy 6.4% YoY for the quarter, supported by a trifecta of labor market resilience, stock market wealth effects, and spring tax refunds. However, the June deceleration to just +0.2% MoM and the structural bifurcation beneath the surface warrant attention. The report highlights a K-shaped consumption pattern: middle- and high-income households continue to spend robustly, while low-income families face mounting pressure from eroded purchasing power, depleted excess savings, and rising consumer credit costs. Excluding the drag from falling gasoline prices (gas station sales -5.3% MoM in June), core retail sales grew a healthy +0.7%, confirming that underlying consumption fundamentals remain intact.
Investment Story: AI-related capital expenditure has become the primary engine of US business investment. The four technology giants — Microsoft, Google, Amazon, and Meta — have announced combined 2026 capex plans totaling approximately $725 billion, driving sustained investment in semiconductors, equipment manufacturing, and digital infrastructure. Excluding aircraft, non-defense capital goods new orders rebounded to +1.6% in May after April’s -0.7% decline, while core capital goods shipments grew for the second consecutive month.
1.2 Global Monetary Policy: A Hawkish Tilt
Table 2: Major Central Bank Policy Actions (Q2 2026)
| Central Bank | Action | Key Rate | Rationale |
|---|---|---|---|
| Federal Reserve | Hold (hawkish signal) | 3.63%–3.64% | 9 of 18 FOMC members expect further hikes by end-2026; inflation remains sticky |
| ECB | +25bp hike | — | Eurozone HICP 3.2%, core HICP 2.6%; Q1 negotiated wages +3.5% |
| Bank of Japan | +25bp hike | — | Import prices +17.5% YoY; spring wage negotiations averaged +5.1% |
The Fed’s June FOMC meeting produced no rate change but revealed a deeply divided committee: 9 of 18 voting members projected further rate increases before end-2026, with inflation persistence as the core concern. May CPI at 4.2% and core PCE at 3.4% both remained significantly above the 2% target. However, June CPI easing to 3.5% (down 0.7pp from May), combined with labor market cooling (only 57K new non-farm jobs, with April and May revised down by 74K), subsequently tempered market expectations for additional tightening.
Japan’s Wage-Price Spiral represents the most significant structural shift among developed economies. With import prices surging 17.5% YoY and spring wage negotiations delivering an average 5.1% increase — the highest in decades — the Bank of Japan faces mounting pressure for further rate normalization. Markets widely expect at least one additional hike before year-end.
1.3 Global Financial Markets: Tech-Led Rally with Quarter-End Volatility
Table 3: Major Equity Index Performance (Q2 2026)
| Index | Q2 2026 Return | Key Driver |
|---|---|---|
| Nikkei 225 (Japan) | +37.21% | Top performer globally; AI theme + yen dynamics |
| NASDAQ Composite (US) | +21.41% | AI technology acceleration; tech earnings optimism |
| S&P 500 (US) | +14.87% | Broad tech-led rally |
| Euro Stoxx 50 | +13.62% | European tech exposure |
| Dow Jones Industrial | +12.90% | Broad market participation |
| DAX (Germany) | +10.21% | Industrial + tech dual support |
| CAC 40 (France) | +7.51% | Moderate European gains |
| FTSE 100 (UK) | +3.65% | Commodity exposure muted gains |
Table 4: Bond and FX Market Movements (Q2 2026)
| Indicator | End-March | End-June | Change |
|---|---|---|---|
| US 1-Year Treasury Yield | 3.68% | 3.98% | +30bp |
| US 10-Year Treasury Yield | 4.30% | 4.44% | +14bp |
| Effective Fed Funds Rate | 3.63% | 3.63%–3.64% | Unchanged |
| DXY (US Dollar Index) | 99.96 | 101.19 | +1.23% |
| USD/CNY Central Parity | 6.92 | 6.81 | RMB +1.6% appreciation |
| CFETS RMB Index | — | — | +1.71% |
Critical Observations:
Equity Markets: The AI theme dominated global equities in Q2 2026. Accelerating commercial deployment of AI technologies lifted earnings expectations across the technology sector, driving a synchronized rally in US, European, and Japanese markets. However, quarter-end brought increased volatility as the Fed’s hawkish signals triggered profit-taking in high-valuation tech stocks.
Bond Markets: The US yield curve bear-flattened, with short-end yields rising significantly more than long-end (+30bp vs. +14bp), reflecting market repricing of near-term Fed policy expectations. The persistent elevation of 10-year yields even after June’s encouraging CPI data suggests residual market concerns about US reflation risk and fiscal financing pressure.
FX Markets: An extraordinary divergence: the renminbi appreciated 1.6% against the dollar even as the DXY rose 1.23%. This counter-cyclical strengthening, supported by a +1.71% rise in the CFETS RMB Index, reflects the fundamental resilience of China’s balance of payments and the credibility of its managed floating exchange rate regime.
2. China GDP Growth and Supply-Side Dynamics
2.1 Headline GDP Performance
China’s economy grew 4.3% YoY in Q2 2026 (0.9% QoQ), bringing H1 2026 cumulative growth to 4.7%.
| GDP Indicator | Q2 2026 | H1 2026 |
|---|---|---|
| YoY Growth | 4.3% | 4.7% |
| QoQ Growth | 0.9% | — |
| Secondary Industry YoY | 3.1% | — |
| Tertiary Industry YoY | 5.1% | — |
| Services Contribution to GDP | 69.4% | +8.2pp vs. prior year |
2.2 Supply-Side: Industrial Production and New Quality Productive Forces
Table 5: Monthly Industrial Production and Key Indicators (H1 2026)
| Indicator | Jan | Feb | Mar | Apr | May | Jun | Jun MoM Change |
|---|---|---|---|---|---|---|---|
| Industrial Value-Added (YoY %) | 6.3 | — | 5.7 | 4.1 | 4.5 | 5.3 | +0.8pp |
| High-Tech Industry (YoY %) | 5.1 | — | 11.7 | 12.8 | 15.1 | 14.1 | -1.0pp |
| Services Production Index (YoY %) | — | — | 5.0 | 4.3 | 4.4 | 4.7 | +0.3pp |
| Sales Ratio (change) | — | — | 0.7 | -0.2 | -0.1 | 0.8 | +0.9pp |
Key Supply-Side Highlights:
- H1 equipment manufacturing value-added grew 9.3%, and high-tech manufacturing surged 13.3% — both significantly outpacing the overall industrial growth rate
- Integrated circuits, industrial robots, and new energy vehicles recorded rapid output expansion, with new growth drivers contributing approximately 50% of total industrial growth
- Modern services (information transmission, software & IT, leasing & business services) maintained double-digit growth rates
- The services sector’s GDP contribution reached 69.4%, up 8.2 percentage points from the prior year — a structural shift toward a consumption-and-services-driven growth model
3. Demand-Side Analysis: The Three Engines Diverge
3.1 Consumption: Slow Recovery with Structural Upgrading
Table 6: Consumption Indicators (H1 2026)
| Indicator | H1 2026 | Key Detail |
|---|---|---|
| Total Retail Sales of Consumer Goods (YoY) | +1.3% | Slowed from Q1; May briefly turned negative |
| June Retail Sales (YoY) | +1.0% | Marginal recovery from May’s dip |
| Service Retail Sales (YoY) | +5.3% | 4.2pp faster than goods retail |
| NEV Passenger Car Penetration Rate (June) | 62.8% | Third consecutive month above 60% |
The consumption recovery remains notably sluggish. Total retail sales grew only 1.3% in H1, with May briefly dipping into negative territory before recovering to +1.0% in June. This weakness is structural rather than cyclical: service consumption (+5.3%) is dramatically outperforming goods consumption, and within goods, green and digital categories are the only bright spots — exemplified by NEV penetration holding above 60% for three consecutive months.
K-Shaped Consumption Pattern: The NIFD report explicitly identifies a bifurcated consumption landscape. Middle- and high-income households maintain robust demand for services and upgrade categories (travel, dining, premium goods), while mass-market and big-ticket item consumption remains subdued. This income-stratified consumption profile is the demand-side mirror of the supply-side structural transformation.
3.2 Investment: Broad-Based Contraction with Pockets of Strength
Table 7: Fixed Asset Investment by Sector (H1 2026, Cumulative YoY %)
| Sector | H1 2026 YoY | Trend | Key Driver/Drag |
|---|---|---|---|
| Total Fixed Asset Investment | -5.7% | Deteriorating | Broad drag from real estate + infrastructure |
| Manufacturing | -1.2% | Turned negative | Traditional manufacturing decline |
| — High-Tech Industry | +4.6% | Still positive | Aerospace, computer/office equipment, information services |
| Real Estate Development | -18.0% | Deepening contraction | Core drag on overall investment |
| Infrastructure | -2.4% | Turned negative | Local fiscal constraints + project pipeline shortage |
| Private Investment | -8.5% | Deep contraction | Confidence repair slow |
Monthly Investment Trajectory (Cumulative YoY %):
| Sector | Jan | Feb | Mar | Apr | May | Jun |
|---|---|---|---|---|---|---|
| Total FAI | 1.8 | 1.7 | -1.6 | -4.1 | -5.7 | — |
| Manufacturing | 3.1 | 4.1 | 1.2 | -0.4 | -1.2 | — |
| Real Estate | -11.1 | -11.2 | -13.7 | -16.2 | -18.0 | — |
| Infrastructure | 11.4 | 8.9 | 4.3 | 0.6 | -2.4 | — |
The investment landscape reveals a structural divergence within a general contraction:
- Real estate is the unambiguous epicenter of the downturn, with investment falling at an accelerating pace (-11.1% in Jan → -18.0% by Jun), reflecting continued developer distress and weak housing demand
- Infrastructure turned negative in the second quarter, driven by local government fiscal constraints (land sales revenue collapse, debt resolution obligations) and insufficient project pipeline readiness
- High-tech manufacturing (+4.6%) stands as the lone bright spot, with aerospace, computing equipment, and information services maintaining rapid investment growth
- Private investment at -8.5% signals that market confidence recovery remains fragile, though the report notes AI-related sectors are attracting concentrated capital inflows — raising concerns about potential over-investment and bubble formation
3.3 Foreign Trade: Resilient Surge with Structural Upgrading
Table 8: Foreign Trade Performance (H1 2026)
| Indicator | H1 2026 YoY | Composition Detail |
|---|---|---|
| Total Goods Trade | +16.9% | Broad-based strength |
| Exports | +13.4% | Volume + price dual support |
| Imports | +22.1% | Price-driven; energy + AI supply chain |
| Mechanical & Electrical Exports | +20.1% | 63.5% of total export value |
| High-Tech Product Exports | +39.0% | Outstanding growth; global competitiveness |
Foreign trade was the standout performer of H1 2026, with exports growing 13.4% and imports surging 22.1%. The export structure continues to upgrade rapidly:
- Mechanical and electrical products now account for 63.5% of total export value, growing 20.1% — reflecting the deepening technological sophistication of China’s manufacturing exports
- High-tech product exports soared 39%, demonstrating Chinese manufacturing’s expanding global competitiveness in advanced sectors
- Import growth was primarily price-driven, with energy, raw materials, and AI supply chain component prices serving as the main inflationary channels
The monthly export trajectory (13.4% in H1 with monthly readings of 8.0% → 19.1% → 11.9% → 11.3% → 11.8% → 13.4% from Jan-Jun) shows stable double-digit momentum, while imports accelerated through the quarter (17.9% → 24.3% → 20.2% → 20.3% → 20.6% → 22.1%).
Keywords: China GDP Q2 2026, China macro economy 2026, NIFD China financial report, China monetary policy 2026, China deleveraging, China real estate market 2026, renminbi appreciation 2026, China AI investment bubble, China fiscal policy outlook, China trade surplus 2026, new quality productive forces China, CASS macro-financial outlook







No comments yet