

A comprehensive analysis of the memory super-cycle — supply discipline, demand structure, and the four businesses masquerading as one sector
Executive Summary
The global memory semiconductor sector has experienced one of the most dramatic price rallies in its history, with DRAM contract prices surging 4.4× to 4.8× over three consecutive quarters (Q4 2025 through Q2 2026). Operating margins at major memory manufacturers have exceeded 80%, triggering a wave of bullish sentiment — and an equally ferocious bear counter-narrative.
This article synthesizes the landmark research report “Global Storage Investment Research 2026” (全球存储投研2026), published by Qidian Finance × Report Hall (起点财经 × 报告厅), which brings together 10 in-depth research articles, 9 proprietary data charts, and a rigorous adversarial verification of the seven most widely circulated bear arguments against the memory sector.
The core thesis: this rally was not born from a sudden demand explosion. It was manufactured by supply discipline — the three major memory manufacturers (Samsung, SK hynix, Micron) reallocating advanced capacity toward High Bandwidth Memory (HBM), creating a structural squeeze in conventional DRAM and NAND supply. The question is not whether prices rose — they did, spectacularly — but whether the demand side can sustain them, and which companies are actually making real money versus riding a beta wave.
Table of Contents
- The Supply-Side Engine: How HBM Drained the DRAM Pool
- The Bear Case: Seven Arguments, Verdict by Verdict
- The Bull Case: Three Pillars That Actually Stand
- Original Manufacturers: Printing Money at 80% Operating Margins
- One Sector, Four Businesses: The 15× Gross Margin Divide
- Alpha vs. Beta: Who Wins When Prices Rise
- The Module Roller Coaster: From Collective Losses to Record Profits
- CXMT (ChangXin Memory Technologies): A Textbook Reversal
- Watch Supply, Not Demand: The Leading Indicator Framework
- Who Makes Real Money: The Final Scorecard
- Key Data Summary & Investment Implications
1. The Supply-Side Engine: How HBM Drained the DRAM Pool
1.1 The Price Surge in Numbers
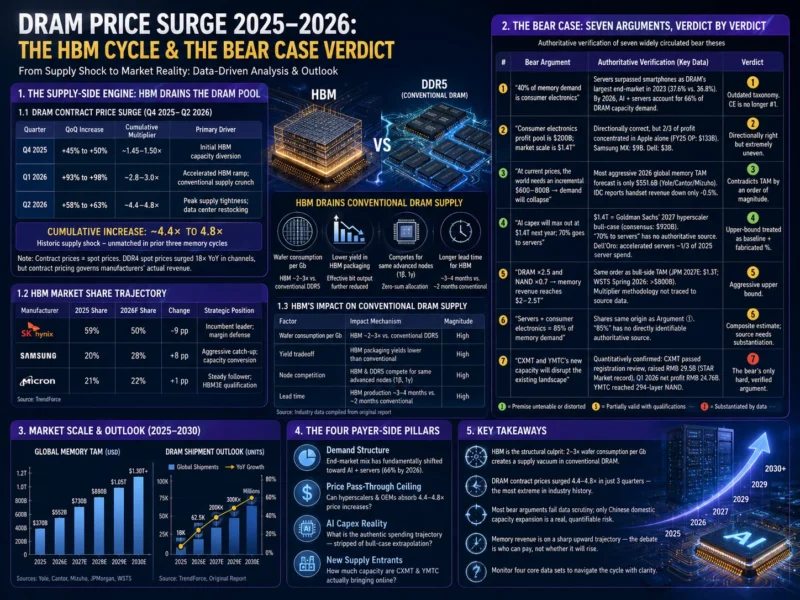
The current memory price rally is among the most aggressive in the industry’s history. DRAM contract prices — which determine original manufacturers’ actual revenue, as opposed to volatile spot prices — experienced three consecutive quantum leaps:
Table 1: DRAM Contract Price Increases (Q4 2025 – Q2 2026)
| Quarter | QoQ Increase | Cumulative Multiplier | Primary Driver |
|---|---|---|---|
| Q4 2025 | +45% to +50% | ~1.45–1.50× | Initial HBM capacity diversion |
| Q1 2026 | +93% to +98% | ~2.8–3.0× | Accelerated HBM ramp; conventional supply crunch |
| Q2 2026 | +58% to +63% | ~4.4–4.8× | Peak supply tightness; data center restocking |
Source: TrendForce contract price data, as cited in the original report
The chain-linked cumulative increase of 4.4× to 4.8× represents a supply shock of historic proportions. To put this in perspective: at no point in the prior three memory cycles (2017–2018, 2020–2021, 2023–2024) did DRAM contract prices compound to this level within three quarters.
Critical methodological note: Contract prices ≠ spot prices. While DDR4 spot prices reportedly surged 18× year-over-year in certain channels, that figure belongs to a different measurement framework and cannot be conflated with the contract pricing that governs original manufacturer profitability. The report explicitly warns against mixing these two metrics.
1.2 The HBM Capacity Drain
The root cause of the conventional DRAM supply squeeze is structural, not cyclical. High Bandwidth Memory (HBM) — the specialized DRAM architecture essential for AI accelerators from NVIDIA, AMD, and custom ASIC designers — consumes vastly more wafer capacity per gigabit than conventional DRAM.
Table 2: HBM Market Share Trajectory (2025–2026F)
| Manufacturer | 2025 Market Share | 2026 Forecast Share | Change | Strategic Position |
|---|---|---|---|---|
| SK hynix | 59% | 50% | -9 pp | Incumbent leader; margin defense |
| Samsung | 20% | 28% | +8 pp | Aggressive catch-up; capacity conversion |
| Micron | 21% | 22% | +1 pp | Steady follower; HBM3E qualification |
Source: TrendForce, as cited in the original report. pp = percentage points
SK hynix’s commanding 59% share in 2025 reflects its first-mover advantage in HBM3 and HBM3E, having been the primary supplier for NVIDIA’s H100 and H200 GPU platforms. Samsung’s projected market share increase from 20% to 28% represents the most aggressive capacity conversion among the three manufacturers, as it reallocates significant conventional DRAM lines to HBM production.
The capacity math is brutal: producing a single HBM stack consumes approximately 2–3× the wafer area of an equivalent gigabit count of conventional DDR5 DRAM, due to the through-silicon via (TSV) stacking process and lower yield rates on the advanced packaging side. When the three majors collectively redirect advanced node capacity toward HBM, the conventional DRAM market faces a supply contraction that demand alone cannot quickly remedy.
Table 3: HBM’s Impact on Conventional DRAM Supply
| Factor | Impact Mechanism | Magnitude |
|---|---|---|
| Wafer consumption per Gb | HBM ~2–3× vs. conventional DDR5 | More wafers consumed for same bit output |
| Yield tradeoff | HBM packaging yields lower than conventional | Effective bit output further reduced |
| Node competition | HBM and DDR5 compete for same advanced nodes (1β, 1γ) | Zero-sum allocation |
| Lead time | HBM production cycle ~3–4 months vs. ~2 months conventional | Capacity lock-in effect |
Source: Industry data compiled from original report and supplementary sources
The implication is clear: HBM is the suction pump draining the conventional DRAM pool. As long as AI accelerator demand sustains HBM orders, the conventional DRAM supply will remain structurally constrained, creating a price floor that did not exist in prior memory cycles.
2. The Bear Case: Seven Arguments, Verdict by Verdict
The original report performs something rarely seen in financial research: a systematic, adversarial verification of bear arguments against authoritative data sources. Seven widely circulated bear theses are examined not by opinion but by arithmetic.
Table 4: The Bear’s Seven Arguments — Complete Adjudication
| # | Bear Argument | Authoritative Verification | Verdict |
|---|---|---|---|
| ① | “40% of memory demand is consumer electronics” | Servers surpassed smartphones as DRAM’s largest end-market as early as 2023 (37.6% vs. 36.8%, TrendForce). By 2026, AI + servers account for 66% of DRAM capacity demand. | 🟡 The “40%” figure uses outdated taxonomy. Consumer electronics is no longer the #1 buyer. |
| ② | “Consumer electronics profit pool is $200B; market scale is $1.4T” | Directionally correct, but 2/3 of profit is concentrated in Apple alone (FY25 operating profit: $133B). Samsung MX: $9B. Dell: $3B. | 🟡 Numbers are directionally right but extremely uneven — not an “industry-wide” average. |
| ③ | “At current prices, the world would need an incremental $600–800B to buy memory → demand will collapse” | The most aggressive 2026 global memory TAM forecast is only $551.6B (Yole/Cantor/Mizuho). IDC reports handset revenue is down only -0.5%. | 🟢 The incremental spend estimate contradicts the total addressable market by an order of magnitude. Static calculation fallacy. |
| ④ | “AI capex will max out at $1.4T next year; 70% goes to servers” | $1.4T = Goldman Sachs’ 2027 hyperscaler bull-case ceiling (consensus: $920B). The “70% to servers” figure has no identifiable authoritative source. Dell’Oro: accelerated servers are ~1/3 of 2025 server spend. | 🟢 Treats an upper-bound scenario as baseline, plus fabricates a percentage. Core numbers are distorted. |
| ⑤ | “DRAM ×2.5 and NAND ×0.7 → memory revenue reaches $2–2.5T” | Same order of magnitude as bull-side TAM estimates (JPM 2027E: $1.3T; WSTS Spring 2026: >$800B). The multiplier methodology hasn’t been traced back to source data. | 🟡 Order of magnitude is not absurd, but leans toward an aggressive upper bound. |
| ⑥ | “Servers + consumer electronics = 85% of memory demand” | Shares the same origin as Argument ①. “85%” has no directly identifiable authoritative source. | 🟡 A composite estimate; source methodology needs substantiation. |
| ⑦ | “CXMT and YMTC’s new capacity will disrupt the existing competitive landscape” | Quantitatively confirmed: CXMT has passed registration review, raised RMB 29.5 billion (a STAR Market record), and reported Q1 2026 net profit of RMB 24.76 billion. YMTC has reached 294-layer NAND. | 🔴 The bear’s only hard, verified argument. Two-Chinese-player additional supply is a genuine cycle-peak risk. |
Source: Original report adversarial verification table. 🟢 = premise untenable or distorted; 🟡 = partially valid with qualifications; 🔴 = bear argument substantiated by verifiable data.
2.1 Verdict Analysis
The adjudication yields a nuanced result: 4 yellow, 2 green, 1 red. The bear case is not a house of cards — it has one genuinely formidable pillar (Chinese domestic capacity expansion). But the majority of its arguments rely on outdated data (Argument ①), apples-to-oranges comparisons (Argument ③), or treating extreme scenarios as baseline assumptions (Argument ④).
The consensus bridge: Interestingly, both bulls and bears agree on the direction of travel. Bulls (JPMorgan 2027E TAM: $1.3T) and bears ($2–2.5T revenue) both acknowledge that memory revenue is heading sharply higher. The disagreement is not about whether revenue will rise, but who can pay for it and whether that payment materializes in earnings.
This is why the report’s analytical framework is built around four sets of verifiable “payer-side” numbers:
1. Demand structure — has the end-market composition genuinely shifted?
2. Price pass-through ceiling — can downstream customers absorb 4.4–4.8× price increases?
3. AI capex reality — what is the authentic spending trajectory, stripped of bull-case extrapolation?
4. New supply entrants — how much capacity is CXMT and YMTC actually bringing online?
3. The Bull Case: Three Pillars That Actually Stand
The report does not dismiss the bull case. It identifies three pillars that are demonstrably real:
Pillar 1: Demand Structure Has Genuinely Shifted
Table 5: DRAM End-Market Demand Structure Evolution
| End Market | 2020 Share | 2023 Share | 2026E Share (AI + Server) | Structural Significance |
|---|---|---|---|---|
| Servers | ~30% | 37.6% | ~40%+ (AI alone) | Now the single largest DRAM consumer |
| Smartphones | ~40% | 36.8% | ~28% | Declining relative weight |
| PC/Notebook | ~15% | ~12% | ~10% | Structural decline |
| Automotive/Industrial/Other | ~15% | ~13.6% | ~6% (non-AI server remaining) | Smaller combined share |
Source: TrendForce, as cited in the original report; 2026E figures are original report projections.
This structural shift is not debatable. Servers overtook smartphones as DRAM’s largest downstream market in 2023. By 2026, AI-related server demand alone absorbs approximately 66% of DRAM capacity. The memory industry is no longer a consumer electronics derivative — it has become an AI infrastructure play.
Pillar 2: AI Capex Is “Higher for Longer”
The hyperscaler capex cycle is demonstrably on a different trajectory from prior enterprise IT cycles. While the bear argument claims AI capex will “max out” at $1.4 trillion (Goldman Sachs’ bull-case ceiling for 2027), the consensus forecast of $920 billion already represents a historically unprecedented level of sustained infrastructure investment.
Table 6: Hyperscaler AI Capex Trajectory (Consensus vs. Bull Case)
| Year | Consensus Capex ($B) | Bull Case ($B) | YoY Growth (Consensus) | Key Drivers |
|---|---|---|---|---|
| 2024 | ~350 | — | +40% | Initial H100/H200 infrastructure build |
| 2025 | ~550 | — | +57% | B200/GB200 ramp; custom ASIC investment |
| 2026E | ~750 | — | +36% | Inference infrastructure scaling |
| 2027E | ~920 | 1,400 | +23% | Next-gen architecture deployment |
Source: Goldman Sachs, JPMorgan, as cited in the original report. Consensus figures are base-case estimates.
The bull argument holds that this capex trajectory creates a sustained demand floor for HBM and, by extension, the entire memory complex. The bear counterargument — that $1.4 trillion is unsustainable — conflates the ceiling scenario with the consensus baseline.
Pillar 3: Original Manufacturer Profits Are Genuine Cash Generation
Micron’s FY2026 Q3 operating margin of 80.4% (up 346% year-over-year) and SK hynix’s Q1 2026 operating margin approaching 72% (near its all-time high) are not accounting artifacts. These are cash profits generated by selling physical wafers at contract prices. The original manufacturers are, in the report’s memorable phrase, “printing money.”
However — and this is the critical qualifier — the report warns that high operating margins at low P/E multiples is a classic cycle-peak signal, not a bargain indicator. SK hynix traded at a P/E of just 2.54× at its 2018 cycle peak and 30.2× at its 2019 cycle trough. In cyclical industries, “cheap on P/E” at the peak often means “about to get much more expensive on collapsing earnings.”
4. Original Manufacturers: Printing Money at 80% Operating Margins
Table 7: Major Memory Manufacturer Profitability at Cycle Peak
| Manufacturer | Metric | Value | Period | YoY Change |
|---|---|---|---|---|
| Micron | Operating Margin | 80.4% | FY2026 Q3 | +346% |
| SK hynix | Operating Margin | ~72% | Q1 2026 | Near all-time high |
| Samsung | Operating Margin (Memory) | ~65–70% (est.) | Q1 2026 | Significantly elevated |
Source: Micron SEC filings, SK hynix and Samsung Electronics official IR materials, as cited in the original report.
These margin levels — particularly Micron’s 80.4% — place the current cycle among the most profitable periods in memory industry history. For context, during the 2017–2018 cycle peak, Samsung’s memory division achieved approximately 70% operating margins; the 2020–2021 cycle saw peaks in the mid-60% range.
Table 8: Memory Cycle Operating Margin Peaks — Historical Comparison
| Cycle | Peak Period | Peak Operating Margin | Subsequent Correction |
|---|---|---|---|
| 2017–2018 | Q3 2018 | ~70% (Samsung Memory) | -35% revenue decline over 5 quarters |
| 2020–2021 | Q2 2021 | ~65% (industry average) | -25% revenue decline over 4 quarters |
| 2025–2026 | Q2 2026 | 80.4% (Micron) | TBD |
Source: Company filings, compiled from original report and supplementary data.
The P/E Trap: The report issues a methodological warning that cannot be overstated for investors: in cyclical industries, high margins + low P/E = peak signal, not value opportunity. SK hynix’s historical P/E range proves this definitively:
- 2018 cycle peak P/E: 2.54× → Subsequent price decline: >50%
- 2019 cycle trough P/E: 30.2× → Subsequent price recovery: >100%
The counterintuitive relationship — low P/E at the top, high P/E at the bottom — is a function of earnings collapsing faster than stock prices during downturns. An investor who sees a 20× P/E on an 80% margin manufacturer and concludes “cheap” is potentially walking into the single most dangerous valuation trap in semiconductor investing.
5. One Sector, Four Businesses: The 15× Gross Margin Divide
This is arguably the report’s most original and actionable analytical contribution. The “memory sector” is not one business — it is four fundamentally different businesses sharing a common supply chain tag. The report demonstrates this through a single, devastating metric: gross margin dispersion.
Table 9: A-Share Memory Sector — 2025 Gross Margin Hierarchy
| Business Layer | Representative Company | 2025 Gross Margin | Revenue Scale | Business Model |
|---|---|---|---|---|
| Interface/IP | Montage Technology (澜起科技) | 62% | RMB 5.46B | DDR5 interface chips; technology licensing |
| Design | Giantec Semiconductor (聚辰股份) | 57% | RMB 1.1B (est.) | EEPROM/SPD design; fabless model |
| Module | Longsys (江波龙) | 19% | RMB 15B+ (est.) | Memory module assembly + brand |
| Distribution | Shannon Semi (香农芯创) | 4% | RMB 35.2B | Component distribution; high-volume, razor-thin margin |
Source: Company annual reports via Wind, as cited in the original report.
The 15× spread between Montage Technology’s 62% gross margin and Shannon Semi’s 4% is not a “gap” — it is evidence of fundamentally different economic models operating under the same “memory sector” label.
5.1 The Four Business Models, Deconstructed
Layer 1 — Interface/IP (Gross Margin: 55–65%)
– Economics: Licensing and chip design for memory interface standards (DDR5 RCD/DB). Revenue scales with DDR5 penetration, not memory prices.
– Risk Profile: Low inventory risk; margin protection through IP moat
– Representative: Montage Technology (澜起科技) — 2025 gross margin 62% on RMB 5.46B revenue
Layer 2 — Design/Fabless (Gross Margin: 45–60%)
– Economics: Fabless semiconductor design for niche memory-adjacent chips (EEPROM, SPD, PMIC). Asset-light; margin determined by design differentiation.
– Risk Profile: Subject to end-demand cycles but insulated from inventory write-down risk
– Representative: Giantec Semiconductor (聚辰股份) — 2025 gross margin 57%
Layer 3 — Module Assembly (Gross Margin: 15–25%)
– Economics: Purchasing DRAM/NAND wafers or chips, assembling into modules, selling to downstream. Gross margin = spread between chip buy price and module sell price + inventory valuation gains/losses.
– Risk Profile: Extreme. In up-cycles, low-cost inventory generates massive valuation gains. In down-cycles, high-cost inventory triggers equally massive write-downs.
– Representative: Longsys (江波龙) — 2025 gross margin 19%; 2023 net loss RMB 828M
Layer 4 — Distribution (Gross Margin: 3–8%)
– Economics: Pure component distribution — buying from manufacturers, selling to downstream OEMs/ODMs. Revenue is volume-driven; margin is a thin spread.
– Risk Profile: Revenue scale is misleadingly large. RMB 35.2B in revenue at 4% margin = RMB 1.4B in gross profit — less economic value than Montage’s RMB 5.46B revenue at 62% margin (= RMB 3.4B gross profit).
– Representative: Shannon Semi (香农芯创) — 2025 gross margin 4% on RMB 35.2B revenue
The report’s key insight: Flat, horizontal comparison across these four layers — comparing P/E, P/B, or revenue growth rates without adjusting for business model — is systematic analytical error. “352 billion in revenue” at Shannon Semi contains less economic substance than “5.46 billion in revenue” at Montage Technology. Using the same valuation yardstick for both is, in the report’s words, “using one ruler to measure four different businesses.”
6. Alpha vs. Beta: Who Wins When Prices Rise
The report’s sixth chapter introduces a critical distinction: a rising price tide does not lift all boats equally. Within the same “design layer,” Q1 2026 net profit trajectories diverged spectacularly.
Table 10: A-Share Memory Design Layer — Q1 2026 Performance Divergence
| Company | Q1 2026 Net Profit YoY | Key Driver | α or β? |
|---|---|---|---|
| Puya Semiconductor (普冉股份) | +1,260% | NOR Flash + EEPROM product cycle; new node qualification | α (generational positioning) |
| Giantec Semiconductor (聚辰股份) | -69% | Product cycle misalignment; pricing pressure in legacy products | Negative α |
| Montage Technology (澜起科技) | +61% (reported) / +20% (core) | DDR5 penetration + investment income (~40% of profit) | Mixed — core business growing but headline figure inflated |
Source: Company Q1 2026 filings via Wind, as cited in the original report.
6.1 The Puya vs. Giantec Divergence
The 1,329-percentage-point spread between Puya’s +1,260% and Giantec’s -69% — two companies technically in the same “design” sub-sector — is the clearest possible illustration that price increases are not universal profit drivers. Puya’s explosive growth came from new-node NOR Flash qualification and next-generation EEPROM product ramps — a generational shift in competitive positioning. Giantec’s decline reflects product-cycle misalignment, where legacy products faced pricing pressure despite the broader memory boom.
6.2 Montage: Peeling Back the Headline
Montage Technology’s Q1 2026 reported net profit growth of +61% appears impressive — until you examine the composition. Core operating profit (扣非净利润) grew only +20%. Approximately 40% of the reported profit came from investment income, not from the DDR5 interface business. This distinction matters enormously for forward-looking valuation: if the investment income component is non-recurring, the headline growth rate overstates the underlying business momentum.
6.3 The A-Share Memory Sector Peak-to-Crash Trajectory
Table 11: A-Share Memory Stock Peak Performance and Subsequent Correction
| Company | Peak Gain from YTD Low | Subsequent 3-Day Decline | Business Layer |
|---|---|---|---|
| Puya Semiconductor (普冉股份) | +496% | -18% to -22% | Design (NOR Flash) |
| Other memory stocks (aggregate) | +69% to +350% | -10% to -22% | Various |
| Sector aggregate | Varied | Broad 10–22% correction | All layers |
A-Share data via Wind, as of July 2, 2026 close. Three-day decline spans July 1 (US market) → July 2 (Korea + A-Share).
The sector-wide 10–22% correction over just three trading days in early July 2026 — triggered by Samsung’s May 19 warning of potential oversupply in 2026 — demonstrates the violent volatility inherent in memory sector investing. The stocks that gained the most (Puya at +496%) also fell the hardest during the correction — a classic β-amplification pattern where the highest-beta names experience the most extreme moves in both directions.
7. The Module Roller Coaster: From Collective Losses to Record Profits
The module layer’s financial trajectory provides the most visceral demonstration of memory cycle dynamics in action.
Table 12: Module Manufacturer Profit Trajectory — The Full Cycle
| Period | Longsys (江波龙) Net Profit | BIWIN (佰维存储) Status | Cycle Phase | Driver |
|---|---|---|---|---|
| FY2023 | -RMB 828M (loss) | Loss | Trough | High-cost inventory write-down; declining ASP |
| FY2024 | ~RMB 300M (est., recovery) | Recovery | Early upswing | Inventory revaluation; stabilizing prices |
| FY2025 | RMB 1.42B | Profit | Mid-cycle | Low-cost inventory gains; rising ASP |
| Q1 2026 | RMB 3.862B (single quarter) | Strong profit | Peak | Inventory valuation gains at maximum spread |
Source: Company annual/quarterly filings via Wind, as cited in the original report.
7.1 The Inventory Valuation Mechanics
The module business model generates profits through a simple but volatile mechanism: buy chips at low prices → hold inventory → sell modules at higher prices. When DRAM prices are rising rapidly (as they are now), modules purchased at lower prices in prior quarters generate massive “inventory valuation gains” when sold at current market prices.
The critical risk: This profit mechanism works in reverse. When the cycle turns and prices decline:
– High-cost inventory purchased near the peak must be written down
– Module ASP declines while COGS remains elevated
– The same “inventory gain” that generated Q1 2026’s RMB 3.862 billion single-quarter profit becomes an equally large loss
Historical precedent: The 2022–2023 cycle provides the template. Module manufacturers experienced exactly this reversal — collective profitability in 2021 → collective losses in 2022–2023 → recovery in 2024–2025. The Q1 2026 numbers are exceptional, but they are exceptional within a pattern, not an exception to the pattern.
7.2 The “Trough P/E Illusion”
The report issues a second methodological warning specifically for module stocks: low P/E ratios at cycle peaks are not bargains — they are “trough P/E illusions.” When current earnings (the denominator) are inflated by unsustainable inventory gains, the resulting low P/E multiple makes the stock appear cheap. When those inventory gains reverse, earnings collapse, and the P/E multiple expands dramatically — possibly to infinity if earnings turn negative.
8. CXMT (ChangXin Memory Technologies): A Textbook Reversal
ChangXin Memory Technologies (CXMT), China’s leading domestic DRAM manufacturer, presents one of the most dramatic financial reversals in recent semiconductor history — and one of the few bear arguments that the original report’s verification process confirmed as genuinely substantiated.
Table 13: CXMT (长鑫科技) Financial Trajectory
| Period | Cumulative Net Profit/Loss | Key Event | Significance |
|---|---|---|---|
| FY2022–2024 | -RMB 31.8B (cumulative loss) | Heavy R&D + capacity ramp phase | Startup-scale losses during technology catch-up |
| Q1 2026 | +RMB 24.76B (single quarter) | Profitability inflection | Single-quarter profit recovers ~78% of three-year cumulative loss |
| 2026 (IPO) | RMB 29.5B raised | STAR Market listing record | Largest STAR Market IPO in history |
Source: CXMT IPO prospectus (Shanghai Stock Exchange disclosure), as cited in the original report.
8.1 The Scale of the Turnaround
The numbers are staggering: a company that lost RMB 31.8 billion cumulatively over three years (2022–2024) generated RMB 24.76 billion in net profit in a single quarter (Q1 2026). This is not merely a cyclical recovery — it represents the moment when years of technology investment and capacity building reached critical mass, coinciding perfectly with the most favorable pricing environment in memory industry history.
8.2 Capacity and Competitive Implications
CXMT’s capacity is reportedly approaching Micron’s scale, making it a genuine third force in the global DRAM market alongside Samsung, SK hynix, and Micron. The RMB 29.5 billion STAR Market IPO provides capital for further expansion. Combined with YMTC (Yangtze Memory Technologies Co.) reaching 294-layer NAND technology, Chinese domestic memory supply is transitioning from “strategic necessity” to “commercial reality.”
Table 14: The Two-Chinese-Player Supply Risk Matrix
| Player | Technology Level | Capacity Status | Market Impact |
|---|---|---|---|
| CXMT (DRAM) | Approaching 1β equivalent | Expanding; approaching Micron scale | Direct competitive pressure on commodity DRAM pricing |
| YMTC (NAND) | 294-layer | Scaling; entity-list constraints | Competitive in NAND; regulatory headwinds limit global reach |
Source: CXMT prospectus, TrendForce, Nikkei Asia, as cited in the original report.
This is the one bear argument the original report marks 🔴 (substantiated): Chinese domestic capacity expansion is real, measurable, and growing. It represents the most concrete risk to the supply-discipline narrative that has driven the current cycle.
8.3 The Two-Sided Coin
The report frames CXMT’s trajectory with unusual nuance: “domestic substitution narrative and global cycle risk are two sides of the same coin.” For investors focused on China’s semiconductor self-sufficiency, CXMT’s progress validates a strategic thesis. For investors focused on global memory cycle dynamics, CXMT’s capacity additions represent a supply overhang that could compress margins for all manufacturers — including CXMT itself.
9. Watch Supply, Not Demand: The Leading Indicator Framework
The report’s ninth chapter presents a deceptively simple but analytically powerful argument: in the current cycle, supply-side variables lead demand-side variables by a significant margin.
9.1 Why Supply Leads
The HBM capacity diversion mechanism means that conventional DRAM supply is a derived variable — it is what remains after HBM demand is satisfied. Since HBM capacity allocation decisions are made 6–12 months in advance (due to the long lead times for advanced packaging equipment), supply shifts are observable well before they affect spot or contract prices.
Table 15: Leading vs. Lagging Indicators in the Memory Cycle
| Indicator | Type | Lead Time | Source | Current Signal |
|---|---|---|---|---|
| Capex guidance (3 majors) | Leading | 6–12 months | Company IR | Samsung: “2026 may see oversupply” (May 19 warning) |
| Wafer capacity allocation (HBM vs. conventional) | Leading | 3–6 months | TrendForce | HBM share rising; conventional constrained |
| Equipment orders (ASML, AMAT, LRCX, TEL) | Leading | 3–9 months | Equipment company reports | Monitor for capacity expansion signals |
| Contract prices | Coincident | 0–1 month | TrendForce | Currently at peak; Q3 2026 direction critical |
| End-demand (server, smartphone, PC shipments) | Lagging | 1–3 months | IDC, Gartner | Currently stable; NOT the primary variable |
| Module manufacturer inventory levels | Lagging/Confirming | 0–2 months | Company filings | Elevated — risk indicator |
Analytical framework: original report synthesis.
9.2 The Samsung Warning
On May 19, 2026, Samsung Electronics issued a qualified warning that 2026 “may see oversupply conditions” in the memory market. This single sentence — from the world’s largest memory manufacturer — triggered the first significant A-share memory sector selloff. The report emphasizes that this kind of supply-side signal from the manufacturers themselves is the highest-quality leading indicator available to investors.
9.3 The Monitoring Framework
The report recommends a three-variable monitoring framework:
- Capex trajectory of Samsung, SK hynix, and Micron — particularly the split between HBM and conventional capacity investment
- Capacity allocation shifts between HBM and conventional DRAM at advanced nodes (1β, 1γ)
- CXMT and YMTC capacity ramp pace — the wild card that could tip the global supply-demand balance
10. Who Makes Real Money: The Final Scorecard
The report concludes with a definitive scorecard that categorizes each layer of the memory sector by the sustainability and quality of its earnings.
Table 16: The Memory Sector Profit Quality Scorecard
| Layer | Profit Driver | Sustainability | Cycle Sensitivity | Valuation Framework | Investment Character |
|---|---|---|---|---|---|
| Original Manufacturers | Cycle elasticity | High during up-cycle; collapses in down-cycle | Extreme | P/B percentile + cycle position | Pure cycle play; buy at trough, sell at peak |
| Interface/IP Design | Generational positioning (DDR5 → DDR6) | Medium-high; protected by technology moat | Moderate | PEG + technology roadmap | Structural growth with cyclical overlay |
| Module Assembly | Unsustainable inventory beta | Low; reverses on cycle turn | Extreme | Inventory-adjusted P/B | Beta amplifier; dangerous at cycle peaks |
| Distribution | Revenue amplifier (thin margin on high volume) | Low but stable | Low | Revenue-based; margin-agnostic | Flow-through business; not a memory exposure play |
Source: Original report synthesis.
10.1 The Investment Implication
The report’s closing argument is both simple and devastating: “Stop asking ‘can I still chase memory stocks?’ — first ask which layer you’re buying, because valuation must use the ruler that matches that layer.”
An investor buying an original manufacturer at the cycle peak is buying cyclical earnings at their most unsustainable level. An investor buying a module maker at an 8× P/E during a price surge is looking at a “trough P/E illusion” — earnings are artificially inflated by inventory gains that will reverse. An investor buying an interface design company at a premium P/E may be justified if the DDR5-to-DDR6 transition provides multi-year structural growth.
The four businesses demand four different analytical frameworks. Using one ruler for all four is, as the report puts it, “systematic analytical error.”
11. Key Data Summary & Investment Implications
11.1 The Killer Numbers — At a Glance
| Metric | Value | Significance |
|---|---|---|
| DRAM Contract Price Increase | 4.4–4.8× (cumulative, Q4 2025–Q2 2026) | The root cause of the entire cycle — a supply shock, not demand explosion |
| Micron Operating Margin | 80.4% (FY2026 Q3, +346% YoY) | Original manufacturers are generating extraordinary cash profits |
| Puya Semiconductor Peak Gain | +496% (from YTD low) | Highest-beta name in A-share storage; fell hardest in correction |
| Gross Margin Spread | 15× (4% distribution → 62% interface) | One sector, four businesses — flat comparison is analytical error |
| Longsys Q1 2026 Net Profit | RMB 3.862B (single quarter > FY2025 full year) | Peak inventory valuation gains; unsustainable at cycle turn |
| CXMT Cumulative Loss (2022–2024) | -RMB 31.8B | The cost of technology catch-up |
| CXMT Q1 2026 Net Profit | +RMB 24.76B (single quarter) | The payoff: 78% of three-year losses recovered in one quarter |
| CXMT IPO | RMB 29.5B raised | STAR Market record; capacity expansion funded |
| SK hynix HBM Share (2025 → 2026F) | 59% → 50% | Leader ceding share as Samsung catches up |
| Samsung HBM Share (2025 → 2026F) | 20% → 28% | Most aggressive capacity conversion among the three |
| A-Share Memory Correction (July 1–2, 2026) | -10% to -22% (3-day) | Sector-wide violent correction following Samsung oversupply warning |
| AI + Server Share of DRAM Capacity | 66% (2026) | Memory is now an AI infrastructure play, not a consumer derivative |
11.2 The Bear-Bull Consensus Base
Both bulls and bears agree on one thing: memory revenue is going up, significantly. The bull case (JPMorgan 2027E TAM: $1.3T) and the bear case (implied revenue: $2–2.5T) share the same directional conviction. The disagreement is about sustainability — whether the demand side can absorb these price levels without demand destruction, and whether new supply entrants will break the incumbents’ pricing power.
11.3 Three Questions Every Memory Investor Must Answer
Based on the report’s analytical framework, we distill three essential questions:
Supply Discipline Duration: How long can Samsung, SK hynix, and Micron maintain production discipline when operating margins exceed 80%? History suggests the temptation to chase volume at high margins is irresistible.
Demand Absorption Capacity: At 4.4–4.8× price increases, at what point do downstream customers (cloud providers, smartphone OEMs, PC manufacturers) begin to reduce memory content per device or delay procurement?
Chinese Capacity Trajectory: CXMT’s Q1 2026 profitability and RMB 29.5B IPO provide the capital and confidence for accelerated capacity expansion. How quickly can this new supply enter the global market, and what market share can it capture?
11.4 Methodological Principles from the Report
The original report concludes with six methodological principles that deserve preservation:
- Contract prices ≠ spot prices. Confusing the two leads to distorted conclusions about manufacturer profitability.
- High margins + low P/E = cycle peak signal, not value. SK hynix’s 2018 P/E of 2.54× is the definitive proof.
- Layered analysis is mandatory. Module gross margins of 15–20% vs. original manufacturer/interface margins of 60%+ is a business model difference, not a performance gap to be closed.
- Distribution revenue is “虚胖” (inflated). Shannon Semi’s RMB 35.2B in revenue at 4% margin does not represent RMB 35.2B of economic value.
- Chinese domestic data must be graded. CXMT prospectus (primary) > audited financials > third-party estimates (TrendForce/Nikkei) > rumors. Mixing sources invalidates the analysis.
- Multi-source adversarial verification. Every material claim should be checked against at least two independent authoritative sources.
Conclusion
The 2026 global memory cycle is not a conventional demand-driven upswing. It is a supply-shock super-cycle manufactured by the three major manufacturers’ strategic reallocation of wafer capacity toward High Bandwidth Memory, creating a structural deficit in conventional DRAM supply that has driven contract prices to cumulative increases of 4.4–4.8×.
The bear case, while containing one genuinely substantiated argument (Chinese domestic capacity expansion), largely rests on outdated demand-structure assumptions and unjustified extrapolation of bull-case scenarios as baseline forecasts. However, the existence of that one hard bear argument — combined with the historical pattern that memory cycles end when operating margins reach their zenith — should give even the most committed bulls pause.
The report’s most important contribution is not its price forecast or stock recommendation (it offers neither). It is its analytical taxonomy — the systematic demonstration that “memory stocks” is not one category but four fundamentally different businesses, each requiring its own valuation framework and each carrying a different risk profile at different points in the cycle.
In the end, the arbiters are not bulls, not bears, but arithmetic — four sets of verifiable numbers that will, in time, deliver their verdict.
This analysis is based on the “Global Storage Investment Research 2026” (全球存储投研2026) report, jointly produced by Qidian Finance (起点财经) and Report Hall (报告厅), published July 3, 2026. All data sources are cited in the original report’s comprehensive data appendix, including Wind (A-share financials/valuations/prices as of July 2, 2026 close), TrendForce (contract prices/HBM market share/demand structure), Goldman Sachs/JPMorgan/Morgan Stanley (TAM and supply-demand forecasts), Micron (SEC filings), SK hynix and Samsung Electronics (official IR), and CXMT IPO prospectus (Shanghai Stock Exchange disclosure).
Disclaimer: This content is based on publicly available information and is for research and informational reference only. It does not constitute any investment advice, does not predict price movements, and does not guarantee returns. Past performance is not indicative of future results. Investment involves risk; decisions should be made with caution.




No comments yet