

Author: Market Research Analysis Team Date: July 2026 Source: Based on the “Embodied Intelligence (Humanoid Robot) Industry Development Blueprint 2026” Reading Time: 35–40 minutes Word Count: ~15,000
Table of Contents
- Executive Summary
- Industry Definition & Scope
- Market Size & Growth Projections (2025–2030)
- Technology Architecture: The Four-Layer Stack
- Industrial Chain Deep Dive
- Competitive Landscape & Key Players
- Application Scenarios & Commercialization Roadmap
- Core Bottlenecks & Systemic Challenges
- 2026–2030 Industry Trend Forecast
- Strategic Recommendations for Stakeholders
- Global Policy Landscape
- Risk Warning & Mitigation Framework
- Key Takeaways
1. Executive Summary
The embodied intelligence industry—centered on humanoid robots—stands at the most pivotal inflection point in its history. By 2026, the sector has moved beyond conceptual hype and entered a phase of deep technological攻坚 (breakthrough), early-stage commercial piloting, and rapid industrial chain formation. This comprehensive analysis, distilled from the authoritative Embodied Intelligence (Humanoid Robot) Industry Development Blueprint 2026, provides a 360-degree view of the market, technology, competitive dynamics, and strategic outlook through 2030.
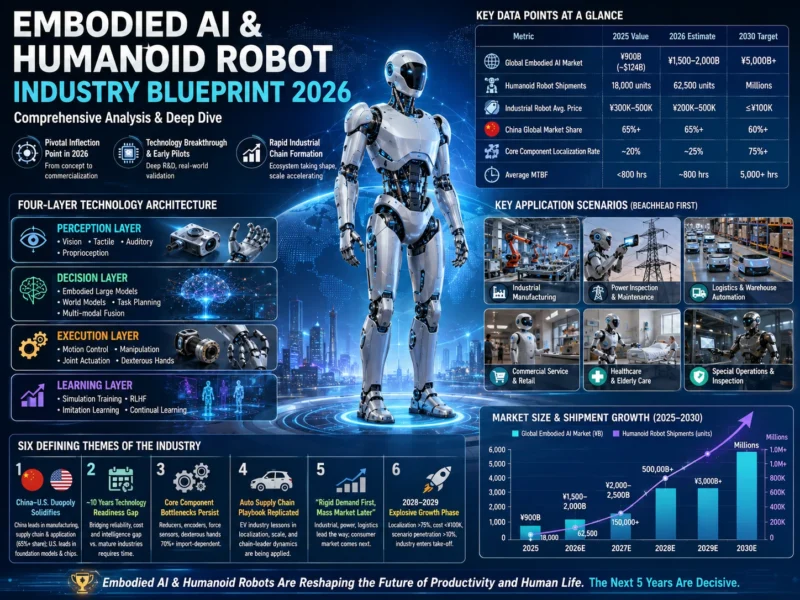
Key data points at a glance:
| Metric | 2025 Value | 2026 Estimate | 2030 Target |
|---|---|---|---|
| Global Embodied AI Market | ¥900B (~$124B) | ¥1,500–2,000B | ¥5,000B+ |
| Humanoid Robot Shipments | 18,000 units | 62,500 units | Millions |
| Industrial Robot Avg. Price | ¥300K–500K | ¥200K–500K | ≤¥100K |
| China Global Market Share | 65%+ | 65%+ | 60%+ |
| Core Component Localization Rate | ~20% | ~25% | 75%+ |
| Average MTBF | <800 hrs | ~800 hrs | 5,000+ hrs |
Six defining themes emerge from the blueprint:
- China-U.S. duopoly solidifies — China dominates manufacturing, supply chain, and application scale (65%+ global share); the U.S. leads in foundational AI models and high-end chips.
- Technology readiness gap vs. mature industries is ~10 years — the sector must bridge reliability, cost, and intelligence deficits before mass adoption.
- Core component bottlenecks persist — precision reducers, high-end encoders, six-axis force/torque sensors, and dexterous hands remain 70%+ import-dependent.
- The automotive supply chain playbook is being replicated — EV industry lessons in chain-leader dynamics, localization, and scale-driven cost reduction are directly applicable.
- Commercialization follows a “rigid demand first, mass market later” path — industrial manufacturing, power inspection, and logistics warehousing are the beachhead scenarios.
- 2028–2029 marks the anticipated “explosive growth phase” — when core component localization exceeds 75%, costs drop below ¥100K/unit, and scenario penetration crosses 10%.
2. Industry Definition & Scope
2.1 What Is Embodied Intelligence?
Embodied intelligence refers to intelligent systems that physically interact with the real world through perception, decision-making, execution, and learning capabilities—with the humanoid robot as its ultimate form. The blueprint positions humanoid robots as the necessary path to Artificial General Intelligence (AGI), arguing that true general intelligence requires a physical body to learn from real-world interaction.
2.2 Three-Tier Industry Taxonomy
The report establishes a clear three-tier classification to delineate what counts—and what doesn’t—as part of the embodied intelligence industry:
| Tier | Categories | Examples |
|---|---|---|
| Core Layer | Humanoid robots, quadruped robots, embodied robotic arms, embodied large models, world models | Tesla Optimus, Unitree H1, Fourier GR-1 |
| Related Layer | Drones, autonomous vehicles, exoskeletons | DJI, autonomous driving platforms |
| Excluded Layer | Traditional industrial robots, single-service robots, pure virtual AI | Fixed-arm factory robots, chatbots |
Why this matters for investors: Only the core and related layers represent the genuine embodied AI thesis. The blueprint cautions against conflating traditional automation (mature, low-growth) with the transformative potential of general-purpose embodied systems.
2.3 The Four-Layer Technology Architecture
The report decomposes humanoid robot technology into four interdependent layers:
- Perception Layer — Vision (3D cameras, LiDAR), tactile (electronic skin, six-axis force/torque sensors), auditory (microphone arrays), and proprioceptive sensors (IMUs, joint encoders)
- Decision Layer — Embodied large models, world models, task planning, natural language understanding, multi-modal fusion
- Execution Layer — Motion control (dynamic walking, whole-body coordination), precision manipulation (dexterous hands), joint actuation (rotary & linear actuators)
- Learning Layer — Simulation-based training, reinforcement learning from human feedback (RLHF), imitation learning, continual learning from real-world deployment data
3. Market Size & Growth Projections (2025–2030)
3.1 Global Embodied AI Market
The global embodied AI market has entered an exponential trajectory, driven by converging advances in AI, manufacturing, and policy support:
| Year | Global Market Size | YoY Growth | Key Driver |
|---|---|---|---|
| 2025 | ¥900B (~$124B) | — | Concept validation, early pilots |
| 2026E | ¥1,500–2,000B | 67–122% | Policy push, industrial pilots scale |
| 2027E | ¥2,000–2,500B | 25–33% | Reliability breakthroughs, localization |
| 2028–29E | ¥3,000B+ | 20–50% | Cost cliff, scenario proliferation |
| 2030E | ¥5,000B+ | — | Mass adoption, C-end entry |
Table 1: Global Embodied AI Market Size Projections (2025–2030)
3.2 Humanoid Robot Shipment Forecast
| Year | Global Shipments | China Share | Average Unit Price (Industrial) |
|---|---|---|---|
| 2025 | 18,000 | ~65% | ¥300K–500K |
| 2026E | 62,500 | ~65% | ¥200K–500K |
| 2027E | 150,000+ | ~65% | ¥150K–250K |
| 2028–29E | 500,000+ | ~65% | ¥100K–200K |
| 2030E | Millions | 60%+ | ≤¥100K |
Table 2: Humanoid Robot Global Shipment Forecast (2025–2030)
3.3 China’s Dominant Position
China’s dominance in the humanoid robot industry is structural, not cyclical:
- 65%+ of global market share across the value chain
- 70%+ of global production capacity expected by 2028
- World’s largest application market — 60%+ of global deployments
- Most complete supply chain — from raw materials to finished systems
- Strongest policy support — dedicated national strategies, local incentives exceeding ¥100M per enterprise
3.4 Investment & Financing Landscape
The sector attracted massive capital inflows in 2025–2026:
- 2025 global embodied AI financing: exceeded ¥200B, with China accounting for ~55%
- 2026 H1: continued acceleration, with average deal sizes growing 40% YoY
- Capital concentration: top 10 enterprises captured 65%+ of total financing
- Hot zones: core components (reducers, sensors), whole-machine leaders, embodied large models
4. Technology Architecture: The Four-Layer Stack
4.1 Perception Layer: The Sensory Foundation
The perception layer is the robot’s window to the physical world. Current technology maturity varies dramatically across sensor types:
| Sensor Type | Domestic Maturity | Import Dependency | Key Gap |
|---|---|---|---|
| 3D Vision Cameras | Medium-High | ~30% | Dynamic range, low-light performance |
| LiDAR | High | <10% | Cost reduction for consumer grade |
| Six-Axis Force/Torque | Low | >90% | Precision ≤0.05N, response ≤0.5ms |
| Tactile Sensors (E-skin) | Low-Medium | >85% | Array density, durability |
| High-Precision Encoders (20-bit+) | Very Low | >95% | Resolution, anti-interference |
| IMUs | Medium | ~40% | Drift compensation |
Table 3: Perception Sensor Technology Maturity Assessment (2026)
Critical finding: Sensor inadequacy directly causes 35% of operational failures in industrial pilots. High-end six-axis force/torque sensors from ATI and Sick cost 3–5x domestic alternatives but deliver the precision needed for fragile object handling and precision assembly.
4.2 Decision Layer: The Intelligence Core
Embodied large models and world models represent the “brain” of humanoid robots. The current state reveals a significant gap between lab performance and real-world requirements:
Key metrics (2026):
- Cross-scene task execution success rate: 62% (target: 99% for industrial use)
- End-side inference latency: >100ms (target: ≤20ms for real-time control)
- Zero-shot/few-shot generalization: extremely limited — most models fail when encountering even minor environmental variations
- Model compression efficiency: significant accuracy loss after compression for edge deployment
The report identifies a “data death spiral”: low shipment volumes → insufficient real-world training data → poor algorithm performance → difficulty landing → even less data. Breaking this cycle requires both simulation-based training (projected to reach 70% of training data by 2029) and cross-enterprise data sharing mechanisms.
4.3 Execution Layer: Motion & Manipulation
Dynamic Walking & Balance
Walking stability remains the single hardest technical challenge for humanoid robots:
- Flat ground continuous walking: adequate
- Stairs, slopes, uneven terrain: high failure rates — 8%+ fall rate in complex industrial workshops
- Continuous stable operation: under 2 hours in complex environments
- Target (2027): MTBF ≥ 2,000 hours, continuous operation ≥ 8 hours
Dexterous Manipulation
Five-finger dexterous hands are transitioning from lab prototypes to engineering-scale production:
- Degrees of freedom: 30–40 DOF for whole body, 12–20 DOF for hands
- Continuous operation life: <1,000 hours for domestic products (target: 5,000 hours industrial)
- Mass production yield: only 60%
- Cost target: ¥10,000 per hand by 2028–29 (currently 3–5x higher)
4.4 Learning Layer: The Path to Generalization
| Training Method | Current Maturity | 2027 Target | 2030 Target |
|---|---|---|---|
| Sim-to-Real Transfer | Medium | 70% simulation reliance | >90% simulation |
| Imitation Learning | Medium-Low | Single-scene proficiency | Multi-scene adaptation |
| RLHF | Early | Industrial task optimization | Consumer interaction |
| Continual Learning | Early | Weekly model updates | Real-time adaptation |
Table 4: Learning Technology Maturity Roadmap
4.5 System Integration: The MTBF Challenge
The report’s most sobering statistic: average MTBF (Mean Time Between Failures) for humanoid robots in 2026 is only 800 hours, versus 5,000+ hours for industrial robots and 50,000+ hours for automotive systems. This single metric encapsulates the industry’s reliability gap.
| System Attribute | 2026 Status | 2027 Target | Mature Industry Benchmark |
|---|---|---|---|
| MTBF (hours) | 800 | 2,000–3,000 | 5,000 (industrial robots) |
| Mass Production Yield | 85% | 95% | 95%+ (industrial robots) |
| Single Unit Assembly Time | 72 hours | 36 hours | 8–12 hours (automotive) |
| Software-Hardware Coupling | High (closed systems) | Semi-open | Standardized interfaces |
| Environmental Protection | Low | Medium | IP67 (industrial) |
Table 5: System Integration Maturity Gap Analysis
5. Industrial Chain Deep Dive
5.1 Upstream: Core Components (70%+ of BOM Cost)
The upstream segment commands the highest gross margins (40–65%) and represents both the biggest bottleneck and the greatest investment opportunity:
| Component | Global Market Leaders | China Leaders | China Market Share | Gross Margin | Import Dependency |
|---|---|---|---|---|---|
| Harmonic Reducers | Harmonic Drive (JP) | Leaderdrive, Green諧波 | ~40% | 45–55% | 60% for high-end |
| RV Reducers | Nabtesco (JP) | Shuanghuan, Zhongda | ~20% | 40–50% | 90% for heavy-load |
| Servo Motors | Yaskawa, Panasonic | Inovance, Estun | ~35% | 30–40% | 50% for precision |
| High-End Encoders | Heidenhain, Nemicon | — | <5% | 55–65% | >95% |
| Six-Axis F/T Sensors | ATI, Sick | — | <10% | 50–60% | >90% |
| Dexterous Hands | Shadow (UK), SCHUNK | Inspire, Agilebot | ~15% | 35–50% | 70% |
| AI Chips | NVIDIA, Intel | Horizon, Cambricon | ~15% | 60–70% | 80%+ |
Table 6: Core Component Supply Landscape (2026)
Key insight: The upstream localization opportunity is the highest-certainty investment thesis in the sector. Harmonic reducers lead the localization race, while high-end encoders and six-axis force/torque sensors represent the most acute bottlenecks with 3–5 year catch-up timelines.
Cost Structure Breakdown
A typical industrial humanoid robot BOM (Bill of Materials) in 2026:
| Component Category | Share of BOM | 2026 Cost (¥) | 2028 Target (¥) |
|---|---|---|---|
| Joint Actuation (reducers, motors, drivers) | 35–40% | 70K–200K | 35K–100K |
| Sensors (vision, force, tactile, IMU) | 15–20% | 30K–100K | 15K–40K |
| Structural & Thermal | 10–15% | 20K–75K | 10K–30K |
| Computing & Power | 10–15% | 20K–75K | 10K–25K |
| Dexterous Hands | 8–12% | 16K–60K | 5K–10K |
| Assembly & Testing | 8–10% | 16K–50K | 5K–15K |
| Total BOM | 100% | 200K–500K | 80K–200K |
Table 7: Humanoid Robot BOM Cost Structure & Reduction Trajectory
5.2 Midstream: Whole-Machine Integration
The midstream segment is undergoing rapid tier differentiation:
Tier 1 (Batch delivery capability):
- Annual capacity approaching 1,000–10,000 units
- Proprietary core technology in at least 2–3 component categories
- Secured industrial pilot orders from major manufacturers
- Examples: Unitree, Fourier Intelligence, UBTECH, Zhiyuan (Agilebot), Xiaomi CyberOne
Tier 2 (Prototype to small batch):
- 100–500 unit annual capacity
- Partial in-house component development
- Early-stage scenario pilots
- Heavy reliance on external financing
Tier 3 (Concept/prototype only):
- No mass production capability
- Dependent on off-the-shelf components
- No confirmed commercial orders
- High risk of elimination during industry consolidation
Current competitive dynamics:
- Hardware gross margins: 15–25% (unsustainably low for most players)
- Service revenue share: <12% of total revenue
- R&D as % of revenue: 50–80% for early-stage companies
- Path to profitability: 3–5 years for most, 2–3 years for leaders
5.3 Downstream: Application & Services
Downstream participants include system integrators, scenario solution providers, operation & maintenance service companies, and rental/leasing platforms. Currently fragmented but expected to consolidate as the industry matures.
5.4 Embodied Operating Systems: The Standards Battle
No unified embodied OS standard exists yet. Multiple competing frameworks are emerging from:
- Whole-machine companies (proprietary OS tied to hardware)
- AI platform companies (OS as ecosystem play)
- Academic consortia (open-source approaches)
The report predicts that by 2030, 1–2 dominant OS platforms will emerge, creating an ecosystem comparable to Android/iOS in mobile, with third-party developers building scenario-specific applications on top.
6. Competitive Landscape & Key Players
6.1 Global Competitive Map
| Dimension | China | United States | Japan | South Korea | Europe |
|---|---|---|---|---|---|
| Whole-Machine Integration | ★★★★★ | ★★★★ | ★★★ | ★★★ | ★★★ |
| Core Components | ★★★ | ★★★★ | ★★★★★ | ★★★ | ★★★★ |
| Embodied AI Models | ★★★★ | ★★★★★ | ★★ | ★★ | ★★★ |
| Manufacturing Scale | ★★★★★ | ★★★ | ★★★ | ★★ | ★★ |
| Application Scenarios | ★★★★★ | ★★★ | ★★ | ★★ | ★★★ |
| Policy Support | ★★★★★ | ★★★ | ★★★★ | ★★★★ | ★★★ |
| Capital Market | ★★★★ | ★★★★★ | ★★ | ★★ | ★★★ |
Table 8: Global Competitive Capability Matrix (2026)
6.2 China’s Competitive Advantages
- Manufacturing ecosystem depth — world’s most complete component supply chain
- Application market breadth — largest industrial, commercial, and consumer markets
- Cost competitiveness — 30–50% cost advantage on equivalent systems
- Policy intensity — national + local government support unmatched globally
- Talent scale — largest STEM graduate pipeline (though specialized talent still scarce)
- EV industry spillover — direct transfer of battery, motor, thermal management, and manufacturing expertise
6.3 The “2+N” Consolidation Thesis
The report projects a “2+N” market structure by 2029–2030:
- 2 global chain-leader enterprises (whole-machine + OS ecosystem)
- N specialized players focusing on vertical scenarios or niche components
The consolidation will be brutal: second-tier startups without core technology, mass production capability, or confirmed orders face extinction.
7. Application Scenarios & Commercialization Roadmap
7.1 Three-Phase Commercialization Pathway
code复制
Phase 1 (2026–2027): Reliability Breakthrough + Rigid Demand Landing
├── Industrial Manufacturing (auto, 3C, new energy)
├── Power Inspection (substation, transmission lines)
└── Logistics Warehousing (sorting, palletizing, transport)

Phase 2 (2028–2029): Cost Cliff + Proliferation
├── Commercial Services (government, hotels, retail, security)
├── Specialty Scenarios (emergency rescue, mining, aerospace)
└── Elderly Care Pilots

Phase 3 (2030+): Consumer Market Entry
├── Home Assistance
├── Education Companionship
└── Entertainment & Lifestyle
7.2 Industrial Scenarios: The Beachhead
Automotive Manufacturing (highest ROI):
- Tasks: component assembly, quality inspection, material handling, welding assistance
- Current penetration: <0.1%, target 10%+ by 2029
- ROI period target: <2 years (currently 2–3 years)
- Key advantage: structured environment, existing automation culture, high labor costs
Power Inspection:
- Tasks: substation patrol, thermal imaging, switch operation, fault diagnosis
- Penetration potential: 15%+ by 2029
- Driver: dangerous/repetitive work, 24/7 operation requirement
Logistics Warehousing:
- Tasks: picking, sorting, packing, palletizing, transport
- Penetration potential: 10%+ by 2029
- Driver: e-commerce growth, labor shortages, warehouse automation trend
7.3 Business Model Innovation
The report emphasizes that pure hardware sales are unsustainable. The winning business model by 2029 will be “Hardware as Platform + Service as Profit Center”:
| Revenue Stream | 2026 Share | 2029 Target | Growth Driver |
|---|---|---|---|
| Hardware Sales | 88% | 60% | Volume growth, cost reduction |
| Software Subscription | 5% | 15% | OS, algorithms, updates |
| O&M Services | 4% | 15% | Fleet management, repairs |
| Data Services | 1% | 5% | Training data, analytics |
| Leasing/Rental | 2% | 5% | Lower procurement barriers |
Table 9: Revenue Mix Evolution (2026–2029)
Innovative commercial models already emerging:
- Robot-as-a-Service (RaaS): pay-per-hour or pay-per-task, zero upfront cost
- Lease-to-own: 3–5 year lease with ownership transfer
- Solution-as-a-Service: bundled hardware + software + maintenance
- Performance-based contracting: payment tied to productivity gains
8. Core Bottlenecks & Systemic Challenges
The report dedicates a full chapter to identifying and analyzing the structural barriers preventing the industry from transitioning from “small-batch pilot” to “large-scale commercial deployment.” These are categorized across four dimensions:
8.1 Technology Bottlenecks
8.1.1 Weak AI Generalization
- Current state: cross-scene task success rate of 62% vs. 99% industrial requirement
- Root cause: single-scene training, insufficient data, poor zero-shot transfer
- Consequence: robots remain “programmable automation devices” rather than truly intelligent systems
- Breaking the cycle requires: simulation training at scale, cross-enterprise data sharing, model architecture breakthroughs
8.1.2 Core Component Import Dependency
- RV reducers: 90%+ import for heavy-load applications; import price 3x domestic; 3–6 month lead time
- High-precision encoders (20-bit+): >95% import dependency; domestic alternatives fail in precision joints
- Six-axis force/torque sensors: >90% import; domestic precision gap of 5–10x
- Planetary roller screws: domestic failure rate 4x higher than imports
- Dexterous hands: domestic lifespan <1,000 hours vs. 5,000-hour industrial requirement; yield rate 60%
8.1.3 Walking & Motion Control Immaturity
- Complex terrain failure rate: 8%+ in industrial workshops
- Continuous walking: <2 hours in complex environments
- Scene-specific calibration: 1–3 months per new environment
- Dynamic balance recovery: insufficient against unexpected obstacles or collisions
8.1.4 System Integration Deficiencies
- Closed architectures: proprietary hardware + proprietary software, zero interoperability between brands
- Modularization gap: single component failure requires whole-system repair
- Environmental ruggedness: dust, oil, vibration cause frequent crashes in industrial settings
- R&D cycle: 18–24 months and ¥100M+ for new models
8.1.5 Testing & Validation Infrastructure
- No national-level testing standards — every company defines its own metrics
- Testing equipment import dependency — joint torque, gait stability, sensor precision test systems
- Lab-to-field gap — products perform well in labs, fail in real environments
8.2 Industry Ecosystem Challenges
| Challenge | Current State | Impact |
|---|---|---|
| Supply-Demand Mismatch | Upstream develops in isolation; downstream needs unclear | 3–6 month component validation cycles; 6–12 month scene adaptation |
| Mass Production Capacity | Top players at 1,000 units/year; 72 hrs/unit assembly | Cannot meet market demand |
| Mass Production Yield | 85% (vs. 95% industrial robot benchmark) | High rework costs inflate unit economics |
| Talent Gap | <10,000 global core R&D talent; China 30% share | 50K+ R&D gap; 30K+ engineering gap; 100K+ technician gap |
| Standards Vacuum | No unified technical, application, safety, or certification standards | Fragmented market; customer trust deficit |
| Supporting Industry | Simulation software, precision machining, O&M services underdeveloped | Full value chain incomplete |
Table 10: Industry Ecosystem Challenge Matrix
8.3 Market Demand Challenges
The Affordability Gap
- Industrial pricing: ¥200K–500K (2026 average)
- Customer willingness: only 15% of industrial enterprises willing to pay >¥200K; 80% expect ≤¥100K
- ROI period: 2–3 years (vs. 1 year for traditional automation)
- Service revenue gap: <12% of revenue, limiting total lifetime value
The Fragmentation Trap
- Every factory, every production line, every task is different
- Customization costs eat into already-thin margins
- Vicious cycle: customization → high cost → low volume → even higher per-unit cost
The Trust Deficit
- Most customers see humanoid robots as “concept demonstrations,” not productivity tools
- Lack of verified ROI case studies creates a “wait-and-see” dynamic
- Public concerns over safety, privacy, and job displacement suppress consumer market development
8.4 Policy & Ethics Challenges
- Regulatory vacuum: no dedicated humanoid robot laws globally
- Safety liability: unclear who is responsible when a robot causes harm
- Employment anxiety: public resistance to labor-replacing technology
- Privacy concerns: always-on cameras and microphones in homes and workplaces
- International standards: dominated by Western and Japanese institutions; China’s participation is limited
8.5 Systemic Breakthrough Pathways
The report outlines a coordinated multi-stakeholder approach:
Short-term (1–2 years):
- Focus government R&D subsidies on four “chokepoint” categories: RV reducers, high-end encoders, six-axis sensors, dexterous hands
- Target 30%+ high-end component localization by 2027
- Build 1–2 national testing and validation platforms
- Launch industrial demonstration projects in auto, power, and logistics
Medium-term (3–5 years):
- Achieve 75%+ core component localization
- Establish complete industry standard systems
- Build automated mass production lines (≤24 hrs/unit)
- Develop “hardware + service” composite business models with 35%+ service revenue
9. 2026–2030 Industry Trend Forecast
9.1 Phase 1: 2026–2027 — Commercial Breakthrough Period
Core mission: eliminate reliability deficits, validate commercialization models, achieve initial localization breakthroughs.
| Metric | Starting Point (2026) | Target (2027) |
|---|---|---|
| MTBF | 800 hrs | 2,000–3,000 hrs |
| Task Success Rate | 62% | 90%+ |
| Fall Rate | 8%+ | <1% |
| High-End Component Localization | ~20% | 40%+ |
| Annual Capacity (leader) | 1,000 units | 10,000 units |
| Mass Production Yield | 85% | 95%+ |
| Industrial Unit Price | ¥200K–500K | ¥150K–250K |
| Service Revenue Share | <12% | 20%+ |
Table 11: 2026–2027 Phase Targets
Competitive dynamic: Industry consolidation begins. Tier-3 players without core technology, mass production capability, or confirmed orders are eliminated.
9.2 Phase 2: 2028–2029 — Explosive Growth Period
Core mission: cost cliff descent, scenario proliferation, global market expansion.
| Metric | Target |
|---|---|
| Core Component Localization | 75%+ |
| Dexterous Hand Cost | ≤¥10,000 |
| 20+ DOF Hands | Mass production achieved |
| Industrial Unit Price | ¥100K–200K |
| MTBF | 5,000+ hrs |
| Assembly Time | <24 hrs/unit |
| Annual Capacity | 100,000+ units (leaders) |
| Industrial Penetration | 10%+ |
| Commercial Service Penetration | 5%+ |
| Global Market Size | ¥3,000B+ |
| Service Revenue Share | 35%+ |
Table 12: 2028–2029 Phase Targets
Key developments:
- “2+N” structure solidifies — top enterprises capture 70%+ market share
- Embodied world models mature — zero-shot/few-shot cross-scene generalization achieved
- Automated production lines — automotive-level manufacturing efficiency
- Global expansion — Chinese enterprises export to 100+ countries
9.3 Phase 3: 2030+ — Ecosystem Maturity Period
- General-purpose humanoid robots replace 70%+ of repetitive human labor
- Industrial price: ≤¥100K; consumer-grade products emerge
- Global market: ¥5,000B+
- C-end home market: initial penetration in high-income households
- Embodied OS: dominant platform(s) emerge with 10,000+ third-party developers
- Brain-computer interfaces, flexible bionics, multi-modal interaction mature
- Human-robot symbiosis becomes social consensus
9.4 Five-Dimensional Trend Matrix
| Dimension | 2026–2027 | 2028–2029 | 2030+ |
|---|---|---|---|
| Technology | Reliability focus; component localization | Full localization; world models mature | General-purpose intelligence; bionic integration |
| Industry | Chain collaboration platforms; cluster formation | 2–3 global chain leaders; complete ecosystem | Industry standards unified; global division of labor |
| Market | B-end rigid demand; light-asset commercial models | B-end full penetration; service revenue ≥35% | C-end entry; global sales networks |
| Global Pattern | China-U.S. duopoly emerges | Duopoly solidified; China = manufacturing + application center | Unified global standards; ecological competition |
| Society | Early adopter skepticism | Growing acceptance; transition training programs | Human-robot symbiosis norm |
Table 13: Five-Dimensional Trend Evolution Matrix (2026–2030)
9.5 Comparison with New Energy Vehicle Industry
The report draws extensive parallels between the humanoid robot and EV industries, arguing that robots will follow—and potentially exceed—the EV trajectory:
| Dimension | EV Industry (Past) | Humanoid Robot (Present/Future) |
|---|---|---|
| Motion Control Difficulty | Wheel-based (low) | Bipedal dynamic balance (5x+ harder) |
| Environment Complexity | Structured roads | Unstructured factories, homes, public spaces |
| Safety Requirements | Passive crash protection | Active human-robot interaction safety |
| Scene Fragmentation | Single (transportation) | 1,000+ distinct industrial/commercial/home scenarios |
| Technology Barriers | Mechanical + Control + Power | + General AI + Embodied Perception + Human-Robot Safety |
| Market Potential | ¥10T level | ¥100T level (“phone quantity × car price”) |
| Chain Leader Role | Tesla, BYD drove full supply chain | 1–2 whole-machine leaders needed |
| Localization Path | Battery → Motor → ECU → Full Vehicle | Reducer → Servo → Sensor → Dexterous Hand → Whole Machine |
| Adoption Sequence | Ride-hailing → Restricted cities → Mass market | Industrial → Commercial → Home |
| Scale Cost Reduction | 60%+ cost reduction through mass production | 60–80% reduction expected by 2029 |
| Data Flywheel | Driving data → OTA → better autonomy | Operation data → model updates → better intelligence |
| Policy Evolution | Subsidies → Standards | Same trajectory; standards focus from 2028 |
Table 14: Humanoid Robot vs. EV Industry Comparison
10. Strategic Recommendations for Stakeholders
10.1 For Upstream Component Enterprises
Short-term (1–2 years):
- Focus on mid-to-low-end market penetration with cost-competitive products
- Target entry into top whole-machine enterprise supply chains
- Joint R&D with whole-machine companies for custom specifications
- Invest in automated production lines
Medium-term (3–5 years):
- Break through high-end technology barriers (RV reducers, high-precision encoders, force sensors)
- Evolve from component supplier to integrated solution provider
- Build global sales networks; participate in international standards
- Construct patent moats around core innovations
10.2 For Whole-Machine & System Software Enterprises
Short-term (1–2 years):
- Abandon parameter-stacking and concept hype; focus on reliability and practicality
- Target 1–2 high-ROI rigid-demand scenarios with standardized, cost-optimized products
- Build automated mass production lines
- System software companies: focus on lightweight, real-time edge deployment
Medium-term (3–5 years):
- Build full-stack capability (hardware + software + algorithms + solutions)
- Open OS and developer interfaces to build an application ecosystem
- Expand to full-scenario product lines (industrial + commercial + specialty + home)
- Global expansion: establish overseas production, sales, and service networks
- Cross-industry integration with EV, consumer electronics, and AI companies
10.3 For Downstream Application & Service Enterprises
Short-term (1–2 years):
- Deeply cultivate a single vertical scenario
- Build professional integration and O&M service teams
- Innovate light-asset business models (leasing, RaaS, performance-based pricing)
Medium-term (3–5 years):
- Partner with top whole-machine companies as exclusive scenario partners
- Accumulate scenario-specific data and operational expertise as competitive moats
- Scale from regional to national to global service provider
10.4 For Investors
Highest-conviction themes:
- Core component localization — reducers, sensors, encoders with proven supply chain entry
- Top-tier whole-machine leaders — full-stack technology + mass production + confirmed orders
- High-ROI scenario application companies — industrial + power + logistics verticals
Investment philosophy:
- Short-term: focus on growth-stage companies with revenue and supply chain traction; avoid pure-concept early-stage bets
- Medium-term: position in top leaders for IPO exit potential; selectively invest in frontier technology
- Industrial capital: strategic investment + supply chain synergy model
- Government funds: focus on early-stage technology攻坚, localization, and public service platforms
Risk management:
- Avoid overvalued concept companies without fundamentals
- Diversify across value chain segments
- Active post-investment value-add (resources, talent, market access)
- Monitor policy, technology, and competitive dynamics continuously
10.5 For Government Policymakers
| Priority | Specific Actions |
|---|---|
| Top-Level Design | National humanoid robot industry development plan; avoid regional homogeneous competition |
| Fiscal Support | Special industry funds; R&D subsidies; tax incentives; first-unit procurement subsidies |
| Technology攻坚 | National innovation consortiums for chokepoint technologies; national labs and engineering centers |
| Standards & Regulation | Full-chain standards (components → safety → applications → ethics); national testing/certification platforms |
| Industry Clusters | World-class clusters in Yangtze River Delta, Pearl River Delta, Beijing-Tianjin-Hebei |
| Talent Pipeline | High-end talent import programs; university curriculum reform; vocational training |
| Demonstration Projects | Scaled application pilots in manufacturing, power, logistics; procurement subsidies for early adopters |
| Globalization Support | Encourage participation in international standards; support overseas expansion |
Table 15: Government Policy Action Framework
11. Global Policy Landscape
11.1 China: Most Aggressive Policy Push Globally
China has established the world’s most comprehensive policy framework for humanoid robots:
| Policy Document | Issuing Body | Date | Key Measures |
|---|---|---|---|
| 15th Five-Year Plan Outline | State Council | Mar 2026 | Humanoid robots as national strategic priority |
| 2026 Government Work Report | State Council | Mar 2026 | Explicit inclusion in “15th Five-Year” core tracks |
| “AI + Manufacturing” Action Plan | MIIT + 8 ministries | Jan 2026 | Up to 30% equipment subsidies for robot production line upgrades |
| Humanoid Robot Standards System (2026) | MIIT Standards Committee | Feb 2026 | 300+ industry standards across 6 domains planned |
| “AI+” Action Implementation | State Council | Aug 2025 | Embodied intelligence as core AI breakthrough direction |
| Future Industry Development Action Plan | MIIT + 7 ministries | Dec 2025 | Humanoid robots among 6 core future industry directions |
Key local policies:
| City | Core Document | Target | Maximum Support per Enterprise |
|---|---|---|---|
| Beijing | Embodied Intelligence Action Plan (2025–2027) | ¥100B cluster by 2027; 10K-unit production; 50+ core enterprises | >¥100M/year |
| Shanghai | Embodied Intelligence Implementation Plan (2025–2027) | ¥50B core industry by 2027; 20 core technologies; 100 benchmark scenarios | ¥40M/year (compute vouchers); ¥5M (sales/lease subsidies) |
| Shenzhen | Embodied Intelligence Robot Action Plan (2025–2027) | 1,200+ cluster enterprises; ¥100B+ related industry by 2027 | ¥50M for national innovation centers; 50 scenarios at ¥1B+ each |
11.2 International Policy Comparison
| Country/Region | Core Policy | Strategic Orientation |
|---|---|---|
| South Korea | 4th Intelligent Robot Basic Plan (2024–2028); K-Humanoid Robot Alliance (2025) | “K-Robot Economy”; ¥3T+ KRW public-private investment; target global top-3 by 2030 |
| Germany | High-Tech Agenda 2025; Technology Sovereignty Framework 2030 | AI-Robot fusion; industrial autonomy; manufacturing competitiveness |
| Singapore | National Robotics Programme; HTX Humanoid Robot Centre (H2RC) | Global test-bed hub; public safety robots by 2027; S$100M H2RC investment |
| EU | EU AI Act (fully effective Aug 2026); Industrial Accelerator Act (2026) | World’s first comprehensive AI regulation; “Made in EU” procurement rules; 20% manufacturing GDP target |
| United States | AI Initiative (2019); Winning the AI Race Action Plan (2025); American Security Robotics Act (2026) | Light regulation, heavy development; federal procurement ban on adversary-nation robots; potential Robot National Strategy executive order |
Table 16: Global Humanoid Robot Policy Comparison
Key geopolitical implications:
- The U.S. American Security Robotics Act (March 2026) explicitly bans federal procurement of humanoid robots from “adversary nations,” creating a de facto market barrier
- The EU’s stringent AI Act classifies industrial humanoid robots as “high-risk AI systems,” imposing compliance costs
- South Korea’s aggressive K-Humanoid Robot Alliance directly targets catching up with China’s manufacturing lead
- China’s policy approach combines aggressive domestic support with growing international standards participation
12. Risk Warning & Mitigation Framework
12.1 Risk Taxonomy
| Risk Category | Severity | Core Manifestation | Affected Parties |
|---|---|---|---|
| Technology Route Iteration | HIGH | Core technology obsolescence; R&D direction errors; breakthroughs slower than expected | Whole-machine, component, software companies; investors |
| Core Component Chokepoint | HIGH | Export bans; supply disruption; price spikes; localization lags | Entire industry chain; national tech autonomy |
| Commercialization Below Expectations | HIGH | Slow scenario landing; insufficient orders; extended ROI; low customer acceptance | Whole-machine, application companies; investor returns |
| Industry Homogenization | MEDIUM | Product commoditization; price wars; margin compression; accelerated consolidation | All enterprises; market order |
| Policy & Standards Shifts | MEDIUM | New standards; tightened regulation; subsidy phase-out; rising compliance costs | All enterprises; development pace |
| Ethics & Social Controversy | MEDIUM | Job displacement; safety/privacy concerns; public resistance | Industry promotion; market demand |
| International Competition & Barriers | MEDIUM | Technology blockade; standards barriers; trade friction; restricted global markets | Whole-machine, component companies; globalization |
| Capital Bubble & Exit Risk | LOW | Overvaluation; funding winter; narrow exit channels; cash flow crises | Startups; investors |
Table 17: Industry Risk Assessment Matrix
12.2 Mitigation Strategies
Technology Risks:
- Adopt “main route + backup route” dual-technology strategy
- Collaborate with universities and research institutions
- Control R&D investment pacing; reserve funds for technology pivots
Supply Chain Risks:
- Diversify supplier base beyond single-country dependency
- Build emergency supply alliances for critical components
- Government: establish strategic component reserves
Market Risks:
- Focus relentlessly on high-ROI rigid-demand scenarios
- Innovate light-asset commercial models to lower procurement barriers
- Government: scale demonstration projects; educate the market
Policy Risks:
- Proactively track and participate in standards development
- Reduce dependency on government subsidies; build market-driven business models
- Maintain open dialogue with regulators
Capital Risks:
- Rational valuation discipline
- Diversify funding sources beyond equity
- Prepare multiple exit pathways (IPO, M&A, strategic sale)
12.3 Three-Layer Risk Protection Mechanism
- Monitoring & Early Warning: government-led industry risk monitoring platform with real-time tracking of technology, market, policy, and competitive dynamics
- Emergency Response: coordinated government-enterprise-investor response mechanism for major disruptions (technology embargo, supply chain rupture, safety incidents)
- Long-Term Prevention: continuous core technology autonomy push; complete standards and regulatory systems; resilient industrial ecosystem
13. Key Takeaways
For Investors
- The humanoid robot thesis is real, but timelines matter. The 2026–2027 period is about reliability and beachhead scenarios, not mass adoption. 2028–2029 is when the hockey stick bends.
- Core component localization is the highest-certainty bet. Harmonic reducers lead, but high-end encoders and six-axis force/torque sensors offer the biggest alpha for those with patience (3–5 year payoff).
- “Pick winners, not the sector.” The “2+N” consolidation means most current players won’t survive. Invest in those with proven supply chain relationships, mass production capability, and confirmed orders.
- Watch the MTBF. When industrial humanoid robots consistently hit 3,000–5,000 hours MTBF, the adoption curve will inflect. Track this metric obsessively.
- The China premium is structural, not speculative. 65%+ market share, most complete supply chain, strongest policy support, and largest application market create a moat that won’t be easily replicated.
For Industry Participants
- Abandon the hype. Customers don’t care about joint counts or walking speed — they care about reliability, ROI, and operational simplicity.
- Your EV supply chain experience is your superpower. Battery technology, motor design, thermal management, and manufacturing excellence transfer directly.
- Hardware is the ticket to entry; services are the profit engine. If your service revenue isn’t trending toward 30%+, your business model is broken.
- Specialization beats generalization (for now). Dominate one scenario before expanding. The company that wins automotive assembly may not win logistics — and that’s okay.
- Talent is your binding constraint. The global talent pool is fewer than 10,000 people. Your ability to attract, retain, and develop talent will determine your ceiling.
For Policymakers
- Standards before subsidies. The industry needs unified technical, safety, and performance standards more than it needs more cash.
- The automotive playbook works. Chain-leader cultivation, localization push, rigid-demand-first adoption — replicate what worked for EVs.
- Don’t ignore the social dimension. Job transition programs and public education on humanoid robots are not optional — they’re prerequisites for C-end market development.
- International engagement matters. China must lead global standards-setting, not just follow. The window is now.
The Big Picture
The humanoid robot industry is following a trajectory remarkably similar to the smartphone industry (2007–2015) and the EV industry (2015–2025), but with even larger potential market size. The thesis that “humanoid robots = phone quantity × car price” implies a total addressable market in the hundreds of trillions of RMB.
The path is clear:
- 2026–2027: Survive the trough of disillusionment — focus on reliability and cost
- 2028–2029: Ride the slope of enlightenment — scale, localize, and penetrate
- 2030+: Harvest the plateau of productivity — dominate a ¥5,000B+ global market
The winners will be those who combine technological depth with manufacturing excellence, who understand that the robot business is fundamentally a manufacturing business enhanced by AI, not an AI business dabbling in hardware.
As the blueprint concludes: “The road is long and obstacles abound, but we will reach the destination if we keep walking. If we walk without stopping, the future is promising.”
Appendix: SEO Metadata
Title: Embodied AI Humanoid Robot Industry 2026: Complete Market Analysis & 2030 Forecast
Meta Description: Comprehensive analysis of the global humanoid robot industry in 2026: $124B+ market, 62,500+ units shipped, China’s 65% dominance, technology bottlenecks, investment opportunities, and 2030 outlook. Based on the authoritative Embodied Intelligence Industry Development Blueprint 2026.
Focus Keyphrase: humanoid robot industry 2026 analysis
SEO Tags: humanoid robot market 2026, embodied AI industry report, humanoid robot investment analysis, China humanoid robot market, humanoid robot technology trends, embodied intelligence blueprint, humanoid robot supply chain, core components localization, humanoid robot commercialization, Tesla Optimus competitor analysis, Unitree humanoid robot, embodied AI market forecast 2030, humanoid robot policy China, RV reducer market, six-axis force torque sensor, dexterous hand technology, humanoid robot MTBF, embodied AI investment thesis, humanoid robot BOM cost, embodied operating system
Category: Market Research / Emerging Technology / Robotics
Schema Type: Article
This analysis is based on the “Embodied Intelligence (Humanoid Robot) Industry Development Blueprint 2026,” a 139-page comprehensive industry report. All data points and projections are sourced from the original report unless otherwise noted. Readers are encouraged to consult the original document for detailed methodology and source data.







No comments yet