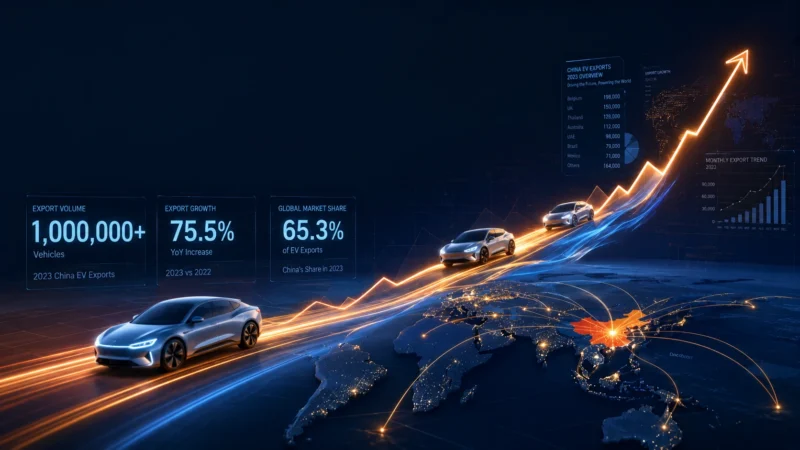


The China Association of Automobile Manufacturers (CAAM) released its June 2026 production and sales data on July 9, 2026, revealing a historic milestone: China’s monthly automobile exports exceeded 1 million units for the first time. While domestic demand remained under significant pressure, exports and new energy vehicles (NEVs) continued to drive structural transformation across the world’s largest auto market. This article provides a comprehensive breakdown of the CAAM data, with detailed tables and analysis across all vehicle segments.
1. Executive Summary: H1 2026 at a Glance
China’s auto industry in the first half of 2026 was defined by three structural divergences, as outlined by CAAM:
| Divergence | Trend | Key Data (H1 2026) |
|---|---|---|
| Domestic vs. Export | Domestic demand slumps; exports surge | Domestic sales: 992.1M units (-21.1% YoY); Exports: 509.6M units (+65.3% YoY) |
| PV vs. CV | Passenger vehicles decline; commercial vehicles grow | PV sales: 1,272M units (-6.0% YoY); CV sales: 229.7M units (+8.3% YoY) |
| ICE vs. NEV | Traditional fuel vehicles shrink; NEVs expand steadily | Traditional fuel domestic sales: 483.1M units (-27.8% YoY); NEV exports: +122.3% YoY |
H1 2026 cumulative results:
| Metric | H1 2026 | YoY Change |
|---|---|---|
| Total Production | 1,499.3 million units | -4.0% |
| Total Sales | 1,501.7 million units | -4.1% |
| Domestic Sales | 992.1 million units | -21.1% |
| Exports | 509.6 million units | +65.3% |
| NEV Exports | 235.5 million units | +122.3% |
The headline numbers mask a profound restructuring: production and sales declines are narrowing month by month, exports are accelerating at an unprecedented pace, and the electrification transition continues to reshape the competitive landscape.
2. Total Auto Market: Production & Sales
2.1 June 2026 Monthly Data
| Metric | June 2026 | MoM Change | YoY Change |
|---|---|---|---|
| Production | 276.0 million units | +5.5% | -1.2% |
| Sales | 281.0 million units | +6.9% | -3.2% |
2.2 H1 2026 vs Historical Annual Data
| Period | Production | YoY | Sales | YoY |
|---|---|---|---|---|
| H1 2026 | 1,499.3M | -4.0% | 1,501.7M | -4.1% |
| Full Year 2025 | — | — | 3,440.0M | +9.4% |
| Full Year 2024 | — | — | 3,143.6M | +4.5% |
Key observation: The cumulative decline narrowed further from the January-May period, indicating that the market trough may be behind us. CAAM expects the second half to improve, supported by policy stimulus (“Two New” policies), new model launches, and relatively stable pricing.
3. Domestic Sales: Double-Digit Decline Signals Weak Consumer Confidence
The most concerning metric in the CAAM report is the sharp contraction in domestic demand.
| Metric | June 2026 | MoM | YoY |
|---|---|---|---|
| Total Domestic Sales | 177.3M units | +4.3% | -23.3% |
| Traditional Fuel Vehicle Domestic Sales | 65.4M units | +0.5% | -45.0% |
| Metric | H1 2026 | YoY Change |
|---|---|---|
| Total Domestic Sales | 992.1M units | -21.1% |
| Traditional Fuel Vehicle Domestic Sales | 483.1M units | -27.8% |
Historical Domestic Sales Trend
| Year | Domestic Sales | YoY Change |
|---|---|---|
| 2024 | 2,557.7M | +1.6% |
| 2025 | 2,730.2M | +6.7% |
| H1 2026 (annualized run rate) | ~1,984.2M | — |
The domestic market is experiencing its most severe contraction since the pandemic era. Traditional fuel vehicle sales have nearly halved year-on-year in June (-45.0%), reflecting both the accelerating EV transition and broader weakness in consumer spending. CAAM identified insufficient domestic demand as the most pressing challenge facing the industry.
4. Exports: Historic Milestone — 1 Million Units in a Single Month
4.1 The Breakthrough
June 2026 marked the first time in history that China’s monthly auto exports exceeded 1 million units, reaching 103.7 million units (+75.1% YoY). This milestone reflects China’s rapidly expanding role as the world’s automotive export powerhouse.
| Metric | June 2026 | MoM Change | YoY Change |
|---|---|---|---|
| Total Exports | 103.7M units | +11.6% | +75.1% |
| NEV Exports | 52.3M units | +17.2% | +160.0% (1.6x) |
| Traditional Fuel Vehicle Exports | 51.4M units | +6.4% | +32.7% |
4.2 H1 2026 Export Breakdown
| Category | H1 2026 Exports | YoY Change | Share of Total Exports |
|---|---|---|---|
| NEV Exports | 235.5M units | +122.3% | 46.2% |
| Traditional Fuel Exports | 274.1M units | +35.5% | 53.8% |
| Total Exports | 509.6M units | +65.3% | 100.0% |
4.3 Export Trend: A Structural Shift
| Year | Total Exports | YoY | NEV Exports | YoY | NEV Share |
|---|---|---|---|---|---|
| 2024 | 585.9M | +19.3% | 128.4M | +6.7% | 21.9% |
| 2025 | 709.8M | +21.1% | 261.5M | +103.7% | 36.8% |
| H1 2026 | 509.6M | +65.3% | 235.5M | +122.3% | 46.2% |
The data reveals a dramatic acceleration: NEV exports have already almost matched all of 2025’s full-year NEV export volume (261.5M) in just six months. By unit count, NEVs now account for nearly half of all exported vehicles, up from just 21.9% in 2024. This confirms that China’s export advantage is increasingly built on electric and plug-in hybrid vehicles.
5. Passenger Vehicle Market: Weak Domestic, Explosive Exports
5.1 PV Production & Sales
| Metric | June 2026 | MoM | YoY |
|---|---|---|---|
| PV Production | 237.3M units | +5.9% | -2.8% |
| PV Sales | 240.2M units | +6.6% | -5.3% |
| Metric | H1 2026 | YoY |
|---|---|---|
| PV Production | 1,272.1M units | -5.9% |
| PV Sales | 1,272.0M units | -6.0% |
| Year | Annual PV Sales | YoY |
|---|---|---|
| 2024 | 2,756.3M | +5.8% |
| 2025 | 3,010.3M | +9.2% |
5.2 PV Domestic vs Export Split
| Metric | June 2026 | YoY |
|---|---|---|
| PV Domestic Sales | 149.7M units | -26.4% |
| — Traditional Fuel PV Domestic | 49.0M units | -49.9% |
| PV Exports | 90.5M units | +80.2% |
| Metric | H1 2026 | YoY |
|---|---|---|
| PV Domestic Sales | 828.8M units | -24.3% |
| — Traditional Fuel PV Domestic | 369.4M units | -31.9% (↓173.2M units) |
| PV Exports | 443.2M units | +71.7% |
The passenger vehicle market tells a stark story: domestic PV sales plunged 26.4% in June, with traditional fuel PV sales nearly halving (-49.9%). Yet PV exports surged 80.2%, largely offsetting domestic weakness in volume terms. In H1 2026, PV exports (443.2M units) already exceeded the domestic PV sales volume (828.8M) at more than half — a ratio that was unthinkable just two years ago.
6. Chinese Brands: Market Share Now Exceeds 75%
The dominance of domestic Chinese brands reached a new high in June 2026:
| Period | Chinese Brand PV Sales | Market Share | YoY Share Change |
|---|---|---|---|
| June 2026 | 181.2M units (+6.2% YoY) | 75.5% | +8.2 pp |
| H1 2026 | 913.8M units (-1.4% YoY) | 71.8% | +3.3 pp |
Market Share by Brand Origin (June 2026)
| Brand Origin | Market Share |
|---|---|
| Chinese | 75.5% |
| German | 9.9% |
| Japanese | 8.4% |
| American | 6.9% |
| Korean | 1.7% |
| Others | 1.3% |
Chinese brands now command more than three-quarters of the domestic PV market in monthly terms, squeezing foreign brands to a combined 24.5% share. German brands (9.9%) remain the largest foreign cohort, followed by Japanese (8.4%) and American (6.9%). Korean and other brands have been marginalized to single-digit combined share.
7. Vehicle Segmentation: B-Segment and Above Dominated by NEVs
7.1 Traditional Fuel PV by Segment (H1 2026)
| Segment | H1 2026 Sales | YoY Change |
|---|---|---|
| A00 | 0 M units | -100.0% |
| A0 | 70.1M units | +8.4% |
| A | 316.3M units | -15.6% |
| B | 148.0M units | -24.0% |
| C | 41.4M units | -22.8% |
| D | 0.09M units | +468.1% |
Traditional fuel PV sales remain concentrated in the A-segment (316.3M units), but all major segments except A0 and D posted double-digit declines. The A00 segment has been entirely eliminated for fuel vehicles.
7.2 NEV PV by Segment (H1 2026)
| Segment | H1 2026 Sales | YoY Change |
|---|---|---|
| A00 | 17.3M units | -66.2% |
| A0 | 116.2M units | +23.9% |
| A | 182.2M units | -5.5% |
| B | 197.8M units | +16.3% |
| C | 139.5M units | +13.5% |
| D | 29.5M units | +73.3% |
NEV passenger vehicle sales are concentrated in the B-segment (197.8M units, +16.3% YoY), with the C-segment (139.5M) and D-segment (29.5M, +73.3%) also showing strong growth. The shift is clear: while fuel vehicle sales are retreating across the board, NEVs are expanding in the higher-value B, C, and D segments. The A00 mini-EV segment contracted sharply (-66.2%), reflecting consumer preference upgrading toward larger, more premium electric models.
8. Pricing Analysis: Mainstream Price Bands Converging
8.1 Traditional Fuel PV by Price Range (H1 2026)
| Price Range (RMB) | H1 2026 Sales | YoY Change |
|---|---|---|
| <100,000 | 45.6M units | -35.0% |
| 100,000–150,000 | 181.2M units | -13.1% |
| 150,000–200,000 | 99.5M units | -24.7% |
| 200,000–250,000 | 55.7M units | +2.7% |
| 250,000–300,000 | 29.6M units | +13.3% |
| 300,000–350,000 | 20.4M units | -37.3% |
| 350,000–400,000 | 11.8M units | -44.3% |
| 400,000–500,000 | 30.8M units | -21.3% |
| >500,000 | 7.6M units | -22.2% |
Traditional fuel PV sales are concentrated in the 100,000–150,000 RMB band (181.2M units), but still declined 13.1% YoY. Only the 200,000–300,000 RMB range showed positive growth.
8.2 NEV PV by Price Range (H1 2026)
| Price Range (RMB) | H1 2026 Sales | YoY Change |
|---|---|---|
| <100,000 | 41.3M units | -37.7% |
| 100,000–150,000 | 157.3M units | +18.1% |
| 150,000–200,000 | 144.5M units | -4.3% |
| 200,000–250,000 | 60.4M units | +4.0% |
| 250,000–300,000 | 70.3M units | +12.6% |
| 300,000–350,000 | 40.4M units | +2.4% |
| 350,000–400,000 | 54.6M units | +16.0% |
| 400,000–500,000 | 12.2M units | -2.2% |
| >500,000 | 22.3M units | +65.1% |
NEV PV sales are also most concentrated in the 100,000–150,000 RMB band (157.3M units, +18.1% YoY), but the premium segment above 500,000 RMB surged 65.1% — driven by high-end Chinese EV brands like AITO, Li Auto, NIO, and BYD’s premium Yangwang and Denza lines. The sub-100,000 RMB segment contracted sharply (-37.7%), reflecting the ongoing market upgrade.
Critical insight: The price convergence between traditional fuel and NEV vehicles in the 100,000–150,000 RMB mainstream band signals that price parity is approaching, with NEVs gaining market share rapidly at equivalent price points.
9. Commercial Vehicle Market: A Bright Spot
While passenger vehicles dragged the overall market down, the commercial vehicle segment continued its recovery and growth trajectory.
9.1 CV Production & Sales
| Metric | June 2026 | MoM | YoY |
|---|---|---|---|
| CV Production | 38.7M units | +3.3% | +9.5% |
| CV Sales | 40.9M units | +8.5% | +10.7% |
| Metric | H1 2026 | YoY |
|---|---|---|
| CV Production | 227.2M units | +8.2% |
| CV Sales | 229.7M units | +8.3% |
| — Natural Gas CV | 14.0M units | +17.9% |
| Year | Annual CV Sales | YoY |
|---|---|---|
| 2024 | 387.3M | -3.9% |
| 2025 | 429.6M | +10.9% |
9.2 Truck (Cargo Vehicle) Segment
| Category | June 2026 | MoM | YoY | H1 2026 | YoY |
|---|---|---|---|---|---|
| Total Trucks | 34.7M | +7.3% | +9.7% | 201.9M | +8.7% |
| Heavy-duty | 11.7M | +6.5% | +19.2% | 66.1M | +22.6% |
| Medium-duty | 1.3M | -2.0% | +30.4% | 7.5M | +25.3% |
| Light-duty | 18.5M | +7.5% | +9.9% | 105.0M | +1.3% |
| Mini-truck | 3.2M | +12.9% | -19.2% | 23.4M | +5.3% |
The truck segment showed broad-based strength, with heavy-duty trucks (+19.2% YoY in June) and medium-duty trucks (+30.4%) benefiting from infrastructure investment and logistics demand.
9.3 Bus Segment
| Category | June 2026 | MoM | YoY | H1 2026 | YoY |
|---|---|---|---|---|---|
| Total Buses | 6.2M | +16.4% | +16.6% | 27.8M | +5.0% |
| Large/Medium Bus | 1.3M | +45.4% | +5.9% | 5.4M | +3.4% |
| Light Bus | 4.9M | +10.7% | +19.8% | 22.5M | +5.4% |
9.4 Pickup Truck Segment (H1 2026)
| Metric | H1 2026 | YoY |
|---|---|---|
| Pickup Production | 34.3M units | +10.9% |
| Pickup Sales | 34.3M units | +9.4% |
| — Gasoline | 9.4M units | +25.2% |
| — Diesel | 20.3M units | +4.4% |
| Top 5 Concentration | 23.1M units (67.4% share) | +13.0% |
| Year | Annual Pickup Sales | YoY |
|---|---|---|
| 2024 | 54.8M | +5.3% |
| 2025 | 60.9M | +11.1% |
10. Key Trends & Market Implications
Trend 1: Exports Now the Primary Growth Engine
With domestic sales declining 21.1% in H1, exports (+65.3%) have become the indispensable growth driver for China’s auto industry. At the current trajectory, full-year 2026 exports could approach or exceed 1.1 billion units, more than double the 2024 level of 585.9 million.
Trend 2: NEV Exports Outpacing ICE Exports
NEV export growth (+122.3% in H1) is dramatically outpacing traditional fuel exports (+35.5%). By unit count, NEVs accounted for 46.2% of all exports in H1 2026, up from 36.8% in full-year 2025. If current trends continue, NEVs could become the majority of China’s auto exports by year-end.
Trend 3: Chinese Brand Dominance Approaching Peak
At 75.5% monthly market share, Chinese domestic brands are squeezing foreign competitors to historically low levels. The combined share of German, Japanese, American, and Korean brands has fallen below 25%. This has profound implications for global automakers’ China strategies.
Trend 4: Commercial Vehicles Decoupling from Consumer Weakness
Unlike passenger vehicles, commercial vehicles (+8.3% H1) are benefiting from policy-driven infrastructure investment and fleet replacement cycles. Heavy-duty trucks (+22.6%) are the standout performer, reflecting continued strength in logistics and construction.
Trend 5: Premiumization of NEVs
While the sub-100,000 RMB NEV segment contracted 37.7%, the 500,000+ RMB premium EV segment surged 65.1%. Chinese EV makers are successfully moving upmarket, challenging traditional luxury brands in their home market.
11. Outlook for H2 2026
CAAM’s assessment for the second half of 2026 is cautiously optimistic:
Positive factors:
- The “Two New” stimulus policies will continue to support consumption
- A steady stream of new model launches from Chinese brands
- Relatively stable pricing environment
- Export momentum expected to persist
Headwinds:
- Complex and uncertain external trade environment
- Persistent weakness in domestic consumer confidence
- Potential trade barriers and tariff risks in key export markets
- Industry profitability under pressure from intense competition
CAAM emphasized the need for stable policy expectations, strengthened regulatory guidance, close monitoring of international developments, and effective risk management to sustain the industry’s recovery trajectory.
12. Data Summary Table: H1 2026 vs Historical Performance
| Metric | 2024 Full Year | 2025 Full Year | H1 2026 | H1 2026 YoY |
|---|---|---|---|---|
| Total Auto Sales | 3,143.6M | 3,440.0M | 1,501.7M | -4.1% |
| Domestic Sales | 2,557.7M | 2,730.2M | 992.1M | -21.1% |
| Exports | 585.9M | 709.8M | 509.6M | +65.3% |
| NEV Exports | 128.4M | 261.5M | 235.5M | +122.3% |
| PV Sales | 2,756.3M | 3,010.3M | 1,272.0M | -6.0% |
| CV Sales | 387.3M | 429.6M | 229.7M | +8.3% |
| Chinese Brand PV Share | — | ~68.5% | 71.8% | +3.3pp |
| Heavy Truck Sales | — | — | 66.1M | +22.6% |
Data source: China Association of Automobile Manufacturers (CAAM) press release, July 9, 2026. All figures are in millions of units unless otherwise specified. This article is for informational and research purposes only and does not constitute investment advice.







No comments yet