

Executive Summary
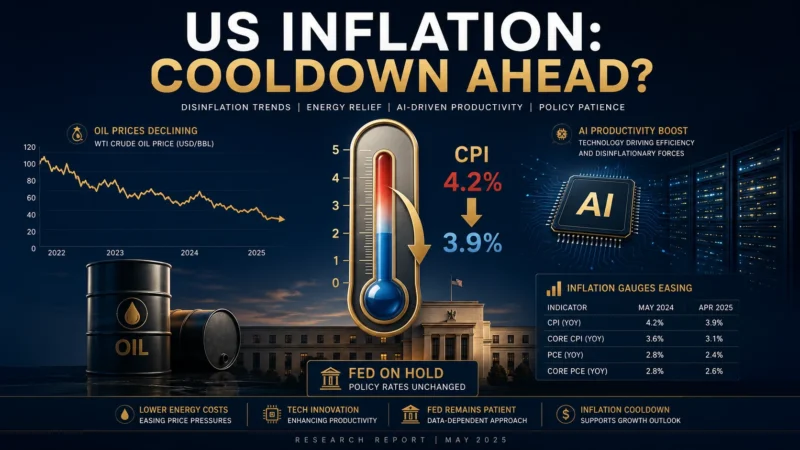
After a turbulent first half of 2026 that saw US inflation reignite to multi-year highs, mounting evidence suggests that the worst may be behind us. The Consumer Price Index (CPI) climbed to 4.2% in May 2026 — a 1.5 percentage point increase from December 2025 levels — driven by a potent mix of energy price shocks, lingering tariff effects, and an unprecedented AI-related demand surge. However, with global oil prices now retreating sharply, tariff pass-through largely exhausted, and a major Bureau of Economic Analysis (BEA) methodology revision on the horizon, the trajectory points decisively toward disinflation in H2 2026 and into 2027.
This article provides a detailed, data-rich analysis of the forces shaping US inflation, the outlook for the coming quarters, and what it all means for Federal Reserve policy.
Keywords: US inflation 2026, CPI forecast, PCE inflation, core inflation cooling, Federal Reserve rate decision, AI inflation impact, US tariff inflation, oil price inflation, BEA methodology revision, US economic outlook 2026–2027, Shenwan Hongyuan research
Part 1: The Three Drivers of US Inflation in H1 2026
According to researchers at Shenwan Hongyuan Securities — led by analysts Zhao Wei, Chen Dafei, Zhao Yu, Wang Maoyu, and Li Xinyue — the inflation pressures observed in the first half of 2026 were not primarily cyclical in nature. Instead, core PCE inflation was overwhelmingly driven by non-cyclical and non-supply-demand factors, pointing to three specific structural drivers.
Driver 1: Energy — The Dominant Force
Energy was the single largest contributor to the H1 2026 inflation surge.
Key Data Points:
| Metric | Value |
|---|---|
| US CPI (May 2026) | 4.2% YoY |
| CPI increase vs. Dec 2025 | +1.5 pp |
| Energy contribution to CPI increase | +1.3 pp |
| Energy’s share of 4.2% CPI | 1.5 pp (vs. Rent: 1.2 pp) |
| PCE gasoline YoY increase | +42.4 pp |
The numbers are staggering: out of the 1.5 percentage point rise in headline CPI from December 2025 to May 2026, energy alone contributed 1.3 percentage points. At the absolute level in May, energy accounted for 1.5 percentage points of the 4.2% CPI reading — exceeding even shelter (1.2 pp).
Driver 2: Tariffs — The Lingering Shock
The tariff shock from earlier policy actions continued to ripple through the US economy in early 2026, though its effects now appear to have peaked.
Tariff Impact Estimates:
| Metric | Estimate |
|---|---|
| Tariff boost to core PCE (early 2026) | ~0.8 pp |
| Tariff boost to core goods PCE (early 2026) | ~3.1 pp |
| Core goods PCE ex-tariffs | Near-deflationary |
The Federal Reserve’s own estimates indicated that tariffs contributed as much as 0.8 percentage points to core PCE inflation in early 2026 (when PCE was running at approximately 3%). The impact on core goods was even more dramatic — a full 3.1 percentage point boost. Stripping out tariff effects, core goods PCE was arguably in deflation territory.
By mid-2026, several signs pointed to tariff effects peaking:
- Core non-used-vehicle goods month-over-month inflation weakened significantly after April 2026, falling below 2023–2025 seasonal norms
- Furniture and related categories showed pronounced weakening
- The Supreme Court’s February ruling on IEEPA tariff authority accelerated the tariff inflation unwind
- The effective tariff rate continued its downward trend
Driver 3: AI — An Unprecedented Demand Shock
Perhaps the most remarkable finding of the report is the outsized role of AI-related spending in driving core inflation, particularly in the PCE measure.
AI Contribution to Core Inflation (Dec 2025 – May 2026):
| Category | Share of Core PCE Increase | Share of Core Goods PCE Increase |
|---|---|---|
| Computer Software & Accessories | 13.2% | 59.6% |
To put this in perspective: nearly 60% of all core goods PCE inflation over this six-month period came from a single category — computer software and accessories. Both figures vastly exceeded historical norms.
AI’s Inflation Transmission Channels:
- Electronic Components: AI data center demand drove up memory (DRAM/NAND) and other component prices, feeding through to consumer electronics like PCs and smartphones
- Software Pricing: AI features embedded in software products pushed up statistically measured prices
- Electricity Services: Data center investment boom potentially lifted US electricity prices
AI Contribution to Inflation (as of May 2026):
| Measure | AI Contribution |
|---|---|
| CPI YoY | +0.1 pp |
| PCE YoY | +0.2 pp |
The AI effect on PCE inflation was notably stronger than on CPI, concentrated primarily in the IT software segment.
Major Software Price Hikes (2025–2026):
| Company | Product/Service | Effective | Price Change |
|---|---|---|---|
| Microsoft | Microsoft 365 Personal (monthly) | Jan 2025 | $6.99 → $9.99, ~+43% |
| Microsoft | Microsoft 365 Family (monthly) | Jan 2025 | $9.99 → $12.99, ~+30% |
| Microsoft | Microsoft 365 Personal (annual) | Jan 2025 | $69.99 → $99.99, ~+43% |
| Microsoft | Microsoft 365 Family (annual) | Jan 2025 | $99.99 → $129.99, ~+30% |
| Workspace Business Starter | Jan 2025 | $6 → $7/user/month, +17% | |
| Workspace Business Standard | Jan 2025 | $12 → $14/user/month, +17% | |
| Workspace Business Plus | Jan 2025 | $18 → $22/user/month, +22% | |
| Adobe | Creative Cloud Photography 20GB | Jan 2025 | $9.99 → $14.99/month, +50% |
| Adobe | Creative Cloud Pro (from All Apps) | Jun 2025 | $59.99 → $69.99/month, +17% |
| Adobe | Creative Cloud All Apps (non-annual) | Jun 2025 | $89.99 → $104.99/month, +17% |
| Intuit | QuickBooks Online / related | Oct 2025 | +45% |
| Atlassian | Jira / Confluence / Cloud | Oct 2025 | +7–10% |
| Apple | Apple Creator Studio | Jan 2026 | ~$12.99/month or $129/year (new) |
| GitHub/Microsoft | GitHub Copilot | Jun 2026 | AI credit/usage model; premium tiers |
AI Hardware Price Surge:
| Timeline | Source | Key Data |
|---|---|---|
| Feb 2026 | Gartner | Memory/SSD costs drive PC prices +17% |
| Q1 2026 | IDC/TrendForce/Counterpoint | Memory crisis: PC +8–20%, Memory +40–60% |
| Jun 2026 | Dell & OEMs | Contract price increases of 15–20% |
| Jun 25, 2026 | Apple | MacBook, iPad official price hikes of 15–25% |
| Jun 2026 | Microsoft | Xbox price increase (storage-driven) |
| Jun 2026 | IDC (updated) | PC ASP forecast: +18.3% |
| H2 2026–2027 | IDC | Supply shortage persists; ASPs remain elevated |
Part 2: The Outlook — Cooling Is Underway
2A. Oil Prices Retreat: Peak Inflation Behind Us
Since June 2026, global oil prices have declined sharply, effectively pulling the rug from under the headline inflation surge.
Oil Prices (as of July 12, 2026):
| Benchmark | Price | Context |
|---|---|---|
| Brent Crude | $76/bbl | Back to late-February levels |
| WTI Crude | $71/bbl | Back to late-February levels |
Federal Reserve Bank of Cleveland Nowcasts (as of report date):
| Metric | Forecast |
|---|---|
| US CPI YoY (June 2026) | 3.92% |
| US PCE YoY (June 2026) | 3.88% |
Both are expected to decline from May levels. The oil price sensitivity analysis shows:
Oil Price Transmission to Inflation:
| Oil Price Move | CPI Impact | PCE Impact |
|---|---|---|
| ±10% | ±24–28 bp | ±15–20 bp |
| Per 10% move on core PCE | — | ~5 bp |
With WTI retreating substantially from its 2026 highs, the implied disinflation relief for core PCE is meaningful.
2B. Tariff Inflation: Fading Fast
The tariff inflation pass-through is now largely complete, with the uncertainty confined to the slope of the decline rather than the direction.
| Tariff Inflation Outlook | Estimate |
|---|---|
| Peak tariff contribution to core PCE (early 2026) | ~0.8 pp |
| Disinflation space from tariff fade | Up to ~0.7 pp (70 bp) |
| Core goods ex-tariffs status | Near-deflationary |
Combined with the Supreme Court’s IEEPA ruling in February, the unwind could be faster than initially anticipated.
2C. Wage and Shelter: Continued Moderation
Two traditional pillars of sticky inflation — wages and housing — both point toward further cooling.
Wage Inflation:
- The US labor market remains in a “low hiring, low layoff” equilibrium
- Wage growth continues to trend lower
- Super-core services inflation remains in a cooling trajectory
- Small business compensation plans have not reversed their downward trend
Shelter Inflation:
- Home price and rent indices point to continued moderation in shelter inflation
- New tenant rent data suggests rental inflation will slow further over the next 12+ months
- Shelter alone is expected to shave at least 0.1 pp (10 bp) off core PCE inflation over the coming year
2D. The BEA Methodology Revision: A Game-Changer
One of the most consequential developments is the BEA’s planned September 2026 annual revision to PCE methodology. The revision specifically targets the “Computer Software and Accessories” category, where a measurement mismatch has significantly overstated inflation.
The Core Problem:
- “Computer Software and Accessories” in PCE carries a weight of 1.1% vs. only 0.03% in CPI (May 2026)
- In CPI, ~11% of this category consists of portable storage devices; in PCE, it is exclusively software services
- Yet BEA currently uses CPI as the deflator for this PCE category — meaning memory chip price surges are being incorrectly applied to software services inflation
BEA Methodology Changes (September 2026 Revision):
| PCE Category | Old Method | New Method (2026 Revision) | Rationale |
|---|---|---|---|
| Legal Services | Used BLS Legal Services CPI (largely unpublished since 2023) | BEA self-constructed composite index using PPI sub-components | Original CPI data fails publication standards; anomalous volatility |
| Portfolio Management & Investment Advice | Used BLS PPI for direct deflation | BEA composite index: Computer Software CPI + Gaming Software PPI + Hosting/ASP PPI + Other IT Infrastructure PPI | Old PPI method misaligned with consumption timing and scale |
| Computer Software & Accessories | Single CPI deflator | Discontinue PPI-based deflation; measure real service consumption via CES employment data extrapolation | Single CPI fails to capture internal product mix shifts |
Estimated Impact:
- According to Bloomberg reports, this methodology revision could lower core PCE inflation by 0.1–0.3 percentage points (10–30 bp)
2E. AI Hardware Inflation: Quantified
A detailed breakdown of AI hardware’s contribution to core PCE:
AI Hardware Impact on Core PCE (May 2026 Weights):
| PCE Category | Core PCE Weight | Hardware Adj. Factor | Adjusted Weight | PCE Boost (bp) |
|---|---|---|---|---|
| Personal Computers & Peripherals | 0.58% | 0.86 | 0.50% | 10.0–20.0 |
| Telephones & Related Equipment | 0.20% | 1.00 | 0.20% | 3.9–7.8 |
| Cellular Mobile Services | 0.92% | 0.25 | 0.23% | 4.6–9.2 |
| Recreational Goods | 0.78% | 0.12 | 0.09% | 1.9–3.7 |
| Total | 2.47% | — | 1.02% | 20.4–40.7 |
The estimated AI hardware boost to core PCE is roughly 20–40 basis points — significant, but dwarfed by other cooling forces.
2F. Comparative Cooling Impact
When all forces are tallied side by side, the direction of travel becomes unmistakable:
Disinflation Contributions — H2 2026 Outlook:
| Driver | Estimated Cooling (bp) |
|---|---|
| Tariff inflation fade | ~70 bp |
| AI hardware (one-time boost, already priced) | 20–40 bp |
| Oil price retreat (core PCE) | ~15 bp |
| Shelter/rent moderation | ≥10 bp |
| BEA methodology revision | 10–30 bp |
| Total potential cooling | Significant across all drivers |
The conclusion is clear: AI inflation alone cannot drive core PCE persistently higher. Broader disinflation across tariffs, energy, and shelter will dominate the trajectory.




No comments yet