

An In-Depth Analysis of PhotonPay’s Comprehensive Report on the Global Gaming Landscape
I. Report Background and Core Thesis
In 2026, PhotonPay released the 2026 Global Game Operations White Paper: From Traffic Growth to Revenue Realization. Based on the latest trends in the global digital entertainment market from 2025 to 2026, the report systematically dissects the profound transformation underway in the game industry — the competitive focus is shifting from “scale growth” to “efficiency competition.”
The global gaming market has entered a stock-driven phase. Following a cyclical recovery, overall growth rates have stabilized, and the head effect has intensified. Data from Sensor Tower and Newzoo shows that the TOP 100 mobile games capture nearly 60% of total market revenue. Under pressure from weakening traffic dividends, soaring user acquisition costs (CPI), and rising user thresholds, the industry’s core question has shifted from “Can we acquire users?” to “Can we efficiently monetize user value?”
The report constructs a complete analytical closed loop spanning “macro policy → micro gameplay → monetization design → payment infrastructure,” connecting the entire value chain from product development to revenue collection, providing a systematic reference framework for game companies going global.
II. Global Gaming Market Landscape: Structural Shifts in a Stock-Driven Era
2.1 Chinese Game Exports: Two Consecutive Years of Recovery, Mobile Dominance
China’s self-developed games in overseas markets have recovered for two consecutive years after bottoming out in 2022. According to the 2025 China Game Industry Report, actual sales revenue of Chinese self-developed games in overseas markets reached USD 20.455 billion in 2025, a year-on-year increase of 10.23%, continuing the rebound momentum from 2024.
Self-developed mobile games generated overseas revenue of USD 18.478 billion, with a year-on-year growth rate of 13.16%. Mobile now accounts for approximately 90% of total overseas game revenue, underscoring its absolute dominance in the export landscape.
Table 1: Chinese Self-Developed Games — Overseas Market Sales Revenue & Growth Rate (2021–2025)
| Year | Total Overseas Revenue (USD Billion) | YoY Growth | Mobile Game Overseas Revenue (USD Billion) | Mobile YoY Growth |
|---|---|---|---|---|
| 2021 | 18.013 | +16.59% | 16.093 | +21.77% |
| 2022 | 17.346 | -3.70% | 15.624 | -2.92% |
| 2023 | 16.366 | -5.65% | 14.693 | -5.96% |
| 2024 | 18.557 | +13.39% | 16.329 | +11.14% |
| 2025 | 20.455 | +10.23% | 18.478 | +13.16% |
Source: 2025 China Game Industry Report
The data trend shows that 2022-2023 was an adjustment period for Chinese game exports. Revenue declined consecutively amid global macroeconomic headwinds, privacy policy shifts (e.g., Apple’s ATT framework), and rising user acquisition costs. The rebound beginning in 2024 indicates the industry has completed a phase of market clearing — products with core competitive strength have reclaimed growth momentum. Notably, the 2025 mobile growth rate (13.16%) significantly outpaced the overall overseas growth rate (10.23%), suggesting that non-mobile export segments are still in recovery.
2.2 Global Mobile Game Revenue Structure: Accelerating Head Concentration
According to Sensor Tower data, global TOP 100 mobile game revenue approached USD 46.6 billion in 2025, capturing 57% of total global mobile game revenue, and is projected to climb further to approximately USD 53.0 billion in 2026. This concentration reveals a stark reality: fewer than 0.01% of mobile games capture nearly 60% of the market.
Table 2: Global Mobile Game Revenue & TOP 100 Revenue Trend (2019–2026E)
| Year | TOP 100 Revenue (USD Billion) | Share of Global Mobile Revenue | Trend Characteristic |
|---|---|---|---|
| 2019 | ~30.0 | ~48% | Long-tail dispersion period |
| 2020 | ~35.0 | ~50% | Pandemic tailwind; broad high growth |
| 2021 | ~38.0 | ~52% | Top products demonstrate IDFA resilience |
| 2022 | ~36.0 | ~53% | Macro downturn; mid-tier elimination |
| 2023 | ~38.0 | ~54% | Premiumization accelerates |
| 2024 | ~42.0 | ~56% | Head barriers continue to consolidate |
| 2025 | ~46.6 | ~57% | Peak head concentration |
| 2026E | ~53.0 | ~58%+ | Further concentration expected |
Source: Sensor Tower (2026 figures are projections)
This trend implies a harsh reality: the survival space for mid-tier and small publishers is being continuously compressed. Top-tier games leverage sustained operational innovation and commercial strategies to build lasting advantages. For smaller publishers, improving operational efficiency and refinement capabilities has become the critical path to survival in an increasingly competitive environment.
2.3 Regional Markets: Asia-Pacific & North America Dominate, Emerging Markets Shine in Growth
Globally, gaming market revenue remains dominated by Asia-Pacific and North America. According to Newzoo’s 2025 Global Games Market Report released in September 2025:
Table 3: 2025 Global Gaming Market Revenue by Region
| Region | Revenue (USD Billion) | Global Share | YoY Growth | Market Profile |
|---|---|---|---|---|
| Asia-Pacific | 87.6 | 46% | +2.3% | Largest stock; slowing growth |
| North America | 52.7 | 28% | +4.2% | High-ARPU mature market |
| Europe | 33.1 | 18% | +3.6% | Stable growth |
| Latin America | 8.3 | 4% | +6.4% | Emerging incremental market |
| Middle East & Africa | 7.1 | 4% | +7.5% | Fastest-growing incremental market |
| Total | 188.8 | 100% | +3.4% | — |
Source: Newzoo, 2025 Global Games Market Report
Asia-Pacific, North America, and Europe together account for 92% of global gaming revenue — the absolute stock base. In growth terms, however, the Middle East & Africa (+7.5%) and Latin America (+6.4%) significantly lead, representing the highest-potential incremental markets.
2.4 Revenue Source Regions for Chinese Game Exports: US-Japan-Korea Contribute Nearly 60%
Consistent with the global landscape, Chinese game export revenue displays clear geographic concentration. The United States, Japan, and South Korea remain the top three markets, together contributing 57.81% of total revenue.
Table 4: Chinese Self-Developed Games — Overseas Revenue by Region
| Rank | Country/Region | Revenue Share | Market Profile |
|---|---|---|---|
| 1 | United States | 32.31% | Largest single market; strong willingness to pay; high ARPU |
| 2 | Japan | 16.35% | East Asian cultural affinity; natural advantage for anime/Three Kingdoms themes |
| 3 | South Korea | 9.15% | Similar to Japan; cultural proximity lowers entry barriers |
| 4 | Germany | 3.84% | Core European market |
| 5 | United Kingdom | 2.92% | Second stop for English-language markets |
| 6 | France | 2.08% | — |
| 7 | Canada | 1.92% | — |
| 8 | Australia | 1.91% | — |
| 9 | Turkey | 1.16% | — |
| 10 | Saudi Arabia | 1.10% | Middle East emerging market representative |
| — | Other Regions | 27.26% | — |
Source: China Audio-Video and Digital Publishing Association, Game Committee
The US market’s commanding lead (32.31%) reflects its position as the world’s largest game consumer market, but also means Chinese export revenue is heavily dependent on a single market. Japan and South Korea together account for 25.50%, reflecting the natural receptivity of East Asian cultural spheres to Chinese games, particularly in anime, Three Kingdoms, and similar themes. Notably, Saudi Arabia (1.10%) has entered the top ten, validating the Middle East as an emerging source of incremental revenue for Chinese game exports.
III. Export Product Characteristics: SLG Dominance and the Rise of Genre Fusion
3.1 Product Type Distribution: SLG Commands Half the Market
Among the top 100 overseas revenue-generating products, genre distribution shows significant variation. Strategy games (including SLG) maintain absolute dominance with a 49.96% share — meaning roughly half of all Chinese game export revenue comes from the strategy genre.
Table 5: Chinese Self-Developed Games — Overseas Revenue by Product Type
| Product Type | Revenue Share | Competitive Landscape |
|---|---|---|
| Strategy (incl. SLG) | 49.96% | Absolute dominance; core competitive advantage for Chinese developers |
| Shooter | 9.69% | High technical and IP requirements; strong head effect |
| RPG | 9.39% | Facing a period of genre fusion transformation |
| Merge | 8.18% | Revenue share approaching RPG; one of the fastest-growing genres |
| Casual | 4.75% | Beneficiary of the casualization trend |
| Match-3 | 3.62% | — |
| MOBA | 2.49% | — |
| Interactive Story | 1.66% | Representative of the female-oriented genre |
| Idle | 1.63% | Beneficiary of the fragmented-content era |
| Card | 1.48% | — |
| Other | 7.15% | — |
Source: China Audio-Video and Digital Publishing Association, Game Committee
Merge games have reached an 8.18% revenue share, approaching RPG’s 9.39% — this is the most notable genre structural shift of the past two years. Chinese developers led by Microfun (柠檬微趣) have successfully pioneered a new growth pole in the female-oriented segment through narrative-driven Merge gameplay, validating the viability of genre-differentiated overseas expansion.
3.2 Top Publisher Competitive Landscape: Majors Lead, Mid-Tier Differentiates
In Q1 2026, total global mobile game revenue across both platforms in overseas markets (excluding China) reached approximately USD 5.82 billion, with Chinese publishers contributing 21.8%, approximately USD 1.27 billion. Chinese games performed exceptionally in overseas revenue rankings: Last War: Survival, Gossip Harbor, Whiteout Survival, and Kingshot all ranked within the global top seven, collectively contributing over USD 600 million.
Table 6: Q1 2026 Top 10 Chinese Mobile Games by Overseas Revenue (Dual Platform, Excluding China)
| Rank | Game Title | Publisher | Core Genre | Est. Monthly Overseas Revenue (USD Million) | Key Feature |
|---|---|---|---|---|---|
| 1 | Last War: Survival | Florere Game | SLG | ~200+ | SLG+X fusion gameplay |
| 2 | Whiteout Survival | Century Games | SLG + Simulation | ~180+ | Idle simulation + 4X SLG |
| 3 | Gossip Harbor | Microfun | Merge | ~150+ | Female-oriented narrative Merge |
| 4 | Kingshot | Century Games | SLG + Tower Defense | ~130+ | New SLG+X title; reached top 3 within 4 months |
| 5 | PUBG MOBILE | Tencent | Shooter | ~120+ | Perennial tactical competitive game |
| 6 | Puzzles & Survival | 37 Interactive | Match-3 + SLG | ~100+ | Cumulative revenue exceeding RMB 10 billion |
| 7 | Genshin Impact | miHoYo | Open-World RPG | ~90+ | Content-driven benchmark |
| 8 | Honkai: Star Rail | miHoYo | Turn-Based RPG | ~80+ | One of miHoYo’s “troika” |
| 9 | Wuthering Waves | Kuro Games (Tencent) | Open-World RPG | ~70+ | Rising anime-style title |
| 10 | Tasty Travels | Century Games | Merge | ~60+ | SLG + casual diversified portfolio |
Revenue figures are estimated ranges based on report charts and publicly available industry data. Source: Sensor Tower
3.3 Chinese Game Publisher Capability Tier Map
The report categorizes Chinese game export publishers into three clear tiers, revealing a distinct “pyramid” capability structure:
Table 7: Three-Tier Capability Map of Chinese Game Export Publishers
| Tier | Representative Publishers | Core Capabilities | Signature Titles | Strategic Characteristics |
|---|---|---|---|---|
| Tier 1: Majors | Tencent, miHoYo, NetEase, Century Games, Microfun | Global publishing & operations, IP ecosystem/investment, multi-product portfolio | PUBG MOBILE, Genshin Impact, Whiteout Survival, Gossip Harbor | Global operating systems, UGC ecosystem, content-driven |
| Tier 2: Mid-Tier | 37 Interactive, Lilith, Moonton, Jiangyu Interactive, Lingxi Interactive | Segment-specific advantage, refined long-term operations, global UA + localization | Puzzles & Survival, Rise of Kingdoms, Mobile Legends | Deep cultivation of SLG/card/simulation |
| Tier 3: Niche | Habby, Papergames, Hypergryph, Kuro Games, XD Network | Vertical innovation, differentiated gameplay, localized market breakthroughs | Capybara Go!, Love and Deepspace, Arknights | Casual/anime/female-oriented vertical breakthroughs |
Source: Public corporate materials, industry reports, and market research
This tiered structure reveals a key trend: Tier 1 publishers have established “systemic barriers to entry” — the long-cycle accumulation of global IP, systematic construction of cross-regional R&D and publishing networks, and long-term operational mechanisms driven by content-based monetization — a combination of advantages that is difficult to replicate in the short term. Mid-tier publishers compete through category depth and differentiated new products, while smaller players achieve localized breakthroughs through innovative gameplay and niche segments.
IV. Genre Fusion and Monetization Strategy: Deep Transformation of Game Business Models
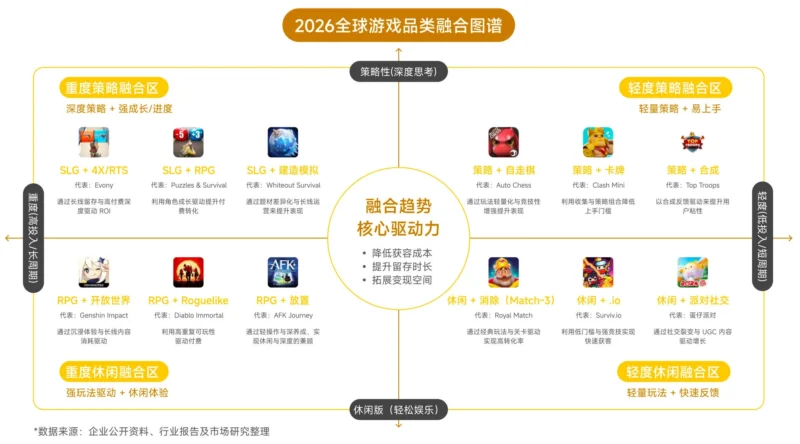
4.1 Four Major Fusion Directions: Reshaping User Acquisition and Monetization Logic
The report categorizes current mainstream genre fusion strategies into four directions, each representing a new equilibrium between user acquisition cost and user lifetime value.
(1) SLG+X: The Casualization of Hardcore Gameplay
SLG, as the core revenue-generating genre for overseas expansion, is lowering acquisition barriers through “sub-gameplay + core gameplay” fusion.
- User Acquisition: Leveraging puzzle, runner, and hyper-casual sub-gameplay creatives to lower CPI. DataEye 2025 data shows that SLG products using sub-gameplay creatives achieve over 40% improvement in user reach efficiency.
- Operations: Fusion gameplay represented by “Match-3 + SLG” and “Tower Defense + SLG” initially retains users through light gameplay, then gradually transitions to SLG progression systems and social competition to boost LTV.
The canonical case is Century Games’ Whiteout Survival. The product initially captures casual players through simulation management, then progressively transitions to RPG character development and SLG alliance warfare, finding a balance between “low-barrier acquisition” and “high-ARPU long-term operations.” This is the core reason the title can rank among the global top-grossing mobile games.
(2) Hybrid Casual: From Ad Monetization to Compound Operations
Hyper-casual games are evolving toward more sophisticated operational models. Compared to the past reliance on pure advertising monetization (IAA), hybrid monetization products now introduce Battle Passes, bundles, subscriptions, and light progression systems, achieving upgrades across three layers:
- Segmented Traffic Management: Using the ad system to cover approximately 70%-80% of non-paying users, ensuring a base level of traffic revenue.
- Long-Term Retention Hooks: Introducing RPG-style progression systems (equipment enhancement, skill trees) to transform short-term casual games into long-term products with “daily active value.”
- Deep Value Mining: Using IAP (in-app purchases) to broaden the revenue ceiling. Through Battle Passes and other subscription services, casual players are converted into “medium-frequency, small-ticket” payers, achieving a “dual-engine drive” of ad and in-app purchase revenue.
(3) Party Game + Social: Viral Growth and Emotional Premium Monetization
Party games represented by Eggy Party, DreamStar, and Stumble Guys are breaking through user acquisition dependency through “casual competitive + strong social matrix”:
- User Acquisition: Leveraging UGC and trendy art styles to trigger viral social media dissemination, achieving “old-brings-new” social circle fission through strong social links.
- Retention and Monetization: Building a “social third space” through real-time voice, guilds, and intimacy chains, driving “emotional premium monetization.” Player payment motivation shifts from topping leaderboards to cosmetic display (skins, blind boxes, emotes), providing publishers with highly predictable long-term cash flow.
The core of this business model lies in converting social relationships into commercial value — not selling players the opportunity to “win,” but selling them the experience of “playing together.”
(4) Idle + RPG: “Time Leverage” Monetization in the Fragmented Era
Facing player time fragmentation, traditional hardcore RPGs suffer declining new user acquisition and retention due to “grind fatigue.” “Idle + deep progression RPG” (e.g., AFK Journey, Idle Heroes) has become an efficient solution:
- User Acquisition: Positioning as “no grind, grow stronger while you sleep,” precisely capturing the workplace casual-gamer demographic that craves RPG progression depth but lacks dedicated play time.
- Retention and Monetization: Replacing tedious grinding with “idle harvesting” to satisfy fragmented play patterns, while retaining hardcore combat ladders, guild wars, and PvP dynamics, maintaining a payment ceiling comparable to traditional hardcore RPGs.
This fusion uses “time leverage” to trade user online time cost for “low-barrier entry, ultra-high progression payment” balance.
4.2 Compound Monetization as the Core Growth Engine for Top Mobile Games
Genre fusion has restructured user demographics, fundamentally changing mobile game monetization logic. A product’s user base may simultaneously contain zero-spend casual players, small-ticket subscribers, and core whale spenders. This diverse user structure necessarily demands a matching diverse monetization design. According to Sensor Tower data, over half of the TOP 100 revenue-generating mobile games employ 5 or more monetization strategies.
Table 8: 2025 Global Top 10 Mobile Games — Monetization Strategy Overview
| Rank | Game Title | Est. 2025 Revenue (USD Billion) | Currency Packs | Live Ops Events | Loot Boxes | Starter Packs | Battle Pass | Subscription | Ads | Remove Ads |
|---|---|---|---|---|---|---|---|---|---|---|
| 1 | Honor of Kings | 2.4 | ✓ | ✓ | ✓ | ✓ | ✓ | ✓ | — | — |
| 2 | Whiteout Survival | 2.1 | ✓ | ✓ | ✓ | ✓ | ✓ | ✓ | — | — |
| 3 | MONOPOLY GO! | 2.1 | ✓ | ✓ | ✓ | ✓ | ✓ | — | — | — |
| 4 | Last War: Survival | 2.0 | ✓ | ✓ | ✓ | ✓ | ✓ | ✓ | — | — |
| 5 | Candy Crush Saga | 2.0 | ✓ | — | — | — | — | — | — | — |
| 6 | Honkai: Star Rail | 1.6 | ✓ | ✓ | ✓ | ✓ | ✓ | ✓ | — | — |
| 7 | Roblox | 1.3 | ✓ | — | — | — | — | ✓ | — | — |
| 8 | PUBG Mobile | 1.1 | ✓ | ✓ | ✓ | — | ✓ | ✓ | — | — |
| 9 | Pokémon TCG Pocket | 1.0 | ✓ | ✓ | ✓ | ✓ | ✓ | ✓ | — | — |
| 10 | Coin Master | 1.0 | ✓ | — | — | — | — | — | ✓ | — |
Source: Sensor Tower
As the table reveals, top mobile games generally employ a combination of 4-7 monetization strategies. Currency packs (100% adoption), live ops events (80% adoption), and Battle Passes (70% adoption) are the three most mainstream monetization tools.
The report categorizes compound monetization models into three core types:
(1) Deep-Payment Model: Gacha and Loot Boxes Driving Burst Revenue
Applicable to anime-style RPGs, heavy SLGs, tactical competitive games, and other mid-to-hardcore long-term products. Core mechanisms include:
– Gacha-driven burst revenue: Probabilistic acquisition of characters, weapons, or limited content, combined with character scarcity, version updates, and content operations to form a sustained consumption cycle.
– Loot boxes as supplementary depth: Random reward mechanisms providing a second payment depth layer, particularly prevalent in the SLG genre.
– Live ops events anchoring payment nodes: Short-cycle events around holidays, version updates, and limited character launches, concentrating payment through limited-time rewards, leaderboards, and crossover content.
– Currency packs as the basic payment channel: In-game hard currency (diamonds, gems, etc.) as the core direct payment form, covering light to heavy payers through different denominations and first-purchase rewards.
(2) Hybrid Monetization Model: IAA + IAP Dual-Engine Drive
Applicable to hybrid casual, light-to-mid-core fusion products. Core characteristics:
– The ad system covers approximately 70%-80% of non-paying users, ensuring a stable ad revenue base.
– Lightweight progression systems and Battle Passes are introduced to gradually convert casual players into light payers.
– Compound bundles and subscriptions at key nodes broaden the revenue ceiling.
(3) Long-Term Subscription Model: Battle Pass and Subscriptions Building Predictable Cash Flow
Applicable to SLG long-term products, cross-platform multi-device products, and competitive games. The seasonal update rhythm of Battle Passes and the recurring payment of subscriptions form a synergy of “sunk cost + sustained value.”
4.3 Pyramid-Style User Payment Structure
The report constructs a clear user segmentation monetization framework, providing precise guidance for game publishers designing event and bundle strategies:
Table 9: Mobile Game User Segmentation and Operational Strategy
| User Tier | Core Characteristics | Typical Spend | Core Mechanism | Core Objective |
|---|---|---|---|---|
| Zero-Spend Users | Provide DAU and ecosystem activity | $0 | Rewarded ads / free rewards | Boost retention and engagement |
| Light Payers | First payment habit establishment | $0.99 first purchase | Starter pack / first-purchase bonus | Complete first conversion |
| Mid-Tier Payers | Stable long-term activity | Monthly pass / subscription ($5-$15/month) | Battle Pass / monthly card / subscription | Increase ARPU and LTV |
| Core Payers (Whales) | High spend, collection-driven | Gacha / limited bundles ($100+/month) | Gacha / limited bundles / rare content | Raise the revenue ceiling |
Source: Public corporate materials, industry reports, and market research
V. The Payment Revolution: From Backend Tool to Strategic Capability Pillar
The report’s unique contribution lies in elevating “payment” — a function typically viewed as backend infrastructure — to strategic height, constructing a complete value chain of “gameplay → monetization → payment.”
5.1 Three Stages of Payment Development in Game Exports
Table 10: Evolution of Payment in Chinese Game Export History
| Stage | Period | Core Characteristics | Payment Positioning | Representative Products / Publishers |
|---|---|---|---|---|
| Extensive Growth | 2013–2017 | Traffic dividend era; SLG reskin + UA rapid expansion; platform 15%-30% commission viewed as “default cost” | Backend tool | COK (ELEX), Revenge of Sultans (Long Tech), Lords Mobile (IGG) |
| Quality Breakthrough | 2018–2022 | Content-driven replaces traffic-driven; third-party payment experimentation begins; official website top-up explored; financial compliance initiated | Supplementary phase | Genshin Impact (miHoYo), PUBG Mobile (Tencent), Puzzles & Survival (37 Interactive) |
| Breakout Explosion | 2023–2025 | Genre fusion + cross-platform publishing + hybrid monetization proliferation; official website direct payment becomes infrastructure; payment platformization | Strategic | Wuthering Waves (Kuro Games), Infinity Nikki (Papergames), Black Myth: Wukong (Game Science) |
Source: PhotonPay, 2026 Global Game Operations White Paper
The core of this evolution: once revenue scale reaches a certain threshold, high platform commissions (15%-30%) become an increasingly visible pressure on corporate profit statements. Top publishers are no longer satisfied with single-channel dependency but are building payment middle-platforms centered on “official website direct payment,” enhancing autonomous control over pricing strategy, user relationships, and profit margins.
5.2 Global App Store Third-Party Payment Liberalization Timeline
Global antitrust and platform openness trends are reshaping the game payment landscape:
Table 11: Global App Store Third-Party Payment Liberalization Timeline (2021–2025)
| Date | Region/Platform | Progress | Key Change / Regulatory Context |
|---|---|---|---|
| Sep 2021 | South Korea | Mandatory third-party payment | World’s first legislation requiring app stores to open third-party payments |
| Sep 2022 | Google Play (multi-market) | UCB pilot launched | Allowed non-game apps to offer third-party payment options |
| Nov 2022 | Japan Google Play | Included in UCB pilot | Initially limited to non-game apps |
| Nov 2022 | Brazil Google Play | Included in UCB pilot | Began testing alternative billing systems |
| Jan 2023 | Epic Games Store (global) | Fully open | Developers free to integrate third-party payments; platform fee fixed at 12% |
| Sep 2023 | EU Google Play | EEA expansion | Further third-party payment liberalization |
| Mar 2024 | EU DMA | Formally effective | Apple first allowed third-party app stores and in-app redirection to third-party payment |
| Sep 2024 | UK Google Play | Compliance preparation & proposal submission | Response to CMA antitrust investigation |
| Mar 2025 | UK Google Play | UCB formally launched | Game restriction lifted; all apps (including games) allowed dual-choice payment |
UCB (User Choice Billing): Google Play’s program allowing users to choose between Google Play billing or developer-provided third-party payment methods at checkout.
Source: National regulatory bodies, platform policy announcements, and public legal documents
This timeline marks the transition of the global app economy from “walled gardens” to “open ecosystems.” For game publishers, this brings three direct benefits: (1) reduced channel commission costs, (2) ownership of user payment data, and (3) the ability to build a proprietary payment-user relationship closed loop.
5.3 Global Payment Preferences and Monetization Characteristics by Market
Regional differences in payment habits are being further amplified — local payment capability now directly affects revenue realization efficiency:
Table 12: Global Major Market Payment Preferences and Monetization Characteristics (Gaming Context)
| Region | Dominant Payment Methods | Credit Card Penetration | Core Monetization Characteristics |
|---|---|---|---|
| North America (US, Canada) | Credit cards, PayPal, BNPL (Affirm, etc.) | High | High ARPU, deep payment; BNPL becoming key tool for Gen Z engagement |
| Japan | Credit cards, PayPay, Konbini (convenience store) | High | Credit cards remain main high-value top-up channel; Konbini covers unbanked users |
| South Korea | Credit cards, KakaoPay, Naver Pay | High | KakaoPay deeply integrated with social ecosystem; high conversion in digital entertainment |
| Southeast Asia (Indonesia, Philippines, etc.) | E-wallets (GCash, OVO, etc.), carrier billing | Very low | Local e-wallets determine conversion ceiling; small-ticket, high-frequency spending prevails |
| Latin America (Brazil, Mexico) | Pix (real-time), Boleto, OXXO | Low | Pix penetration high; convenience store cash payment covers unbanked population |
| India | UPI | Very low | Zero or ultra-low fee rates; ideal for hyper-casual and small-ticket, high-frequency scenarios |
| Europe | Credit cards, local payment methods | High | Significant inter-country payment preference variation; requires localized adaptation |
Source: PayPal, Newzoo, Statista, Worldpay, NPCI, and regional payment platform public reports
For game publishers, insufficient local payment coverage and mismatches between payment methods and user habits directly translate into lower top-up conversion rates and revenue leakage. Payment capability has begun to directly impact revenue realization efficiency — it is no longer merely a transaction channel.
5.4 Payment Failure: The #1 Killer of Revenue Leakage
A joint Newzoo-Visa survey reveals staggering data: 47% of users abandon purchases due to payment failure, limited payment options, or unavailability of preferred payment methods. 44% of users abort payment due to hidden fees, auto-renewal surprises, or opaque final pricing.
Table 13: Primary Reasons Users Abandon In-Game Purchases
| Abandonment Reason | Share | Corresponding Solution |
|---|---|---|
| Payment repeatedly declined / limited options / preferred method unavailable | 47% | Expand local payment method coverage |
| Hidden fees or unexpected charges / dissatisfied with final price | 44% | Price transparency; local currency settlement |
| Distrust of website / slow or unresponsive site | 39% | Payment page optimization; latency reduction |
| Foreign currency settlement only / foreign taxes / foreign language | 29% | Localized payment experience |
| Payment security or personal data protection concerns | 21% | Security certification reinforcement; data protection compliance |
Source: Newzoo × Visa
This data clearly demonstrates that user willingness to pay ≠ revenue realization. Every friction point in the payment journey can become a funnel leak point for revenue. The report’s core thesis advocates “bringing revenue realization capability forward” — shifting from “post-hoc remediation” to “pre-emptive efficiency optimization.” Through payment routing optimization, intelligent risk control pre-positioning, and localized payment experiences, friction is minimized at the very moment of the user’s payment decision.
5.5 Global Game Subscription Penetration
Subscriptions, as a critical component of compound monetization, show significant regional penetration variation:
Table 14: 2025 Global Game Subscription Penetration by Region
| Region | Subscription Penetration | Market Characteristics |
|---|---|---|
| North America | 73% | Most mature subscription market |
| Europe | 60% | Second-highest penetration region |
| Asia-Pacific | 41.2% | Greatest growth potential |
| Latin America | ~50% (est.) | Rapid catch-up |
Source: PlayerCounter
The global game subscription market has reached approximately USD 11.4 billion, with roughly 35% of active players holding at least one game subscription service. The market is projected to grow to approximately USD 14.3 billion by 2026, surpassing 120 million subscribers.
VI. PhotonPay Game Payment Solutions: Bridging the Last Mile of Revenue Realization
As the publisher of this white paper, PhotonPay’s game payment solutions represent the evolutionary direction of industry infrastructure. Its core capabilities are built around five product lines:
Table 15: PhotonPay Game Payment Solution Matrix
| Product Line | Core Functions | Coverage | Core Pain Points Addressed |
|---|---|---|---|
| Multi-Currency Accounts | Multi-platform centralized collection, original-currency receipt, flexible account architecture, real-time fund dashboard | App Store, Google Play, AdMob, Steam, and other major platforms | Fragmented collection paths, inconsistent settlement cycles, currency mix complexity |
| Global FX | 60+ currency support, 24/7 service, diversified FX solutions | Global | High costs, low efficiency, and FX losses from traditional banking |
| Global Payouts | Payments to 200+ countries/regions, e-wallet payouts (75 countries), batch payments | 200+ countries and regions globally | Multi-channel ad spend distribution, influencer commissions, and other high-frequency disbursements |
| Photon Card | Multi-currency virtual/physical cards, Apple Pay/Google Pay integration, real-time spend tracking | Global | Convenient management of high-frequency corporate expenditures |
| Embedded Finance (EmFi) | API rapid integration, modular capabilities: account opening, card issuing, payouts | API-based access | Deep integration of payment capabilities into product logic for cost reduction and efficiency gains |
Source: PhotonPay official materials
VII. In-Depth Case Studies
7.1 Tier 1 Publishers: Global Operating Systems Building Competitive Moats
Tencent: From Capital M&A to Ecosystem Cultivation
Tencent’s international game revenue reached RMB 77.4 billion (approx. USD 10.7 billion) in 2025, a year-on-year increase of 33%, surpassing the USD 10 billion mark for the first time. Its overseas operational footprint spans four phases:
| Phase | Period | Key Actions |
|---|---|---|
| Early Exploration | 2011–2015 | Controlling stake in Riot Games; strategic investment in Epic Games |
| Accelerated Expansion | 2016–2020 | Controlling stake in Supercell (2025 revenue: USD 3.01 billion); acquisition of Turtle Rock |
| Continued Acquisition | 2021–2022 | Increased stake in Riot Games; acquired Klei Entertainment, Grinding Gear Games |
| Strategic Focus | 2023–Present | Controlling stake in Kuro Games; invested in Techland; premiumization and ecosystem operations |
In Q4 2025, multiple Tencent overseas products delivered standout performance: Clash Royale hit recent highs in DAU and gross revenue; Warframe achieved historical highs in average DAU and revenue following “The Old Peace” update; Wuthering Waves (Kuro Games) topped iOS bestseller charts across multiple overseas markets. Tencent’s recent overseas game investment strategy has shifted toward a “minority stake + core IP” combination, emphasizing risk diversification and using capital leverage to unlock proven content assets.
miHoYo: Content-Driven “Troika”
miHoYo’s “troika” of Genshin Impact, Honkai: Star Rail, and Zenless Zone Zero has taken shape. Running multiple products in parallel provides overall revenue resilience even when individual title revenue fluctuates. In 2025, miHoYo initiated notable commercialization strategy adjustments: Honkai: Star Rail‘s second-anniversary version introduced small-ticket bundles, limited-time cumulative top-up mechanics, and concert-driven offline events to stimulate user returns. Simultaneously, miHoYo continues to strengthen the HoYoverse account system and official top-up channel construction, progressively enhancing autonomous control over user relationships and revenue realization chains through official website direct payment.
NetEase Games: Dual Growth Engine
NetEase has formed a “new product breakout + classic IP rejuvenation” growth pattern. Where Winds Meet reached Steam Global Top Sellers #2 after overseas launch; Eggy Party has developed a mature UGC model through three years of operations; in 2025, Justice Online mobile officially launched overseas, topping download charts across multiple Asian regions; Marvel Rivals Season 6 climbed to Steam Global Top Sellers #2.
7.2 Mid-Tier Publishers: Segment Focus and Differentiated Breakthroughs
37 Interactive: AI-Driven Scaled Operations
Core product Puzzles & Survival has generated cumulative revenue exceeding RMB 10 billion (approx. USD 1.4 billion) since its 2020 launch. 37 Interactive has built its proprietary industry large model “Xiaoqi” as the foundation, constructing 40+ AI capabilities spanning art, UA, customer service, and operations, maintaining relatively stable profit margins even amid persistently rising UA costs. Their publishing model follows a unique validation path: low-cost domestic mini-program ecosystem testing → UA amplification to overseas apps → extension to PC/console multi-platform, extending a single product’s lifecycle to 36+ months.
Moonton: Esports Moat and Capital Transformation
Mobile Legends: Bang Bang has built a complete esports ecosystem spanning Southeast Asia and has been selected as an official esports gold medal event at the 2026 Aichi-Nagoya Asian Games. In March 2026, ByteDance sold Moonton to Saudi sovereign fund-backed Savvy Games Group for over USD 6 billion, marking a reconfiguration of Southeast Asia’s mobile esports competitive landscape as Chinese-backed regional game assets enter the purview of global strategic capital.
7.3 Niche Publishers: Vertical Breakthroughs Through Intensive Cultivation
Papergames (叠纸游戏): Technological Elevation in the Female-Targeted Genre
Papergames achieved estimated full-year, all-platform gross revenue exceeding RMB 7 billion (approx. USD 970 million) in 2024. Love and Deepspace is China’s first full-3D flagship otome game, attempting global simultaneous launch for the first time; Infinity Nikki delivers an open-world dress-up experience across mobile, PC, and console using UE5, with overseas PlayStation and PC revenue accounting for up to 80%. In 2025, Love and Deepspace won “Best Mobile Game” at Gamescom — a historic moment as a top global gaming award was conferred on a female-targeted game for the first time.
Habby (海彼游戏): A Replicable Hit Formula
Habby has developed a clear “Roguelike + X” product methodology: using Roguelike mechanics as the underlying framework, layering fusion gameplay to lower accessibility barriers, paired with IAP + IAA hybrid monetization to achieve scaled global user coverage. Capybara Go! and Archero 2 both ranked among the 2024 annual overseas breakout top ten. Habby has established a replicable product incubation cadence — launching a new Roguelike fusion product every one to two years — maintaining the overall revenue curve through new product relay. It is one of the few domestic publishers capable of sustained breakout success in the hyper-casual track.
VIII. Key Conclusions and Trend Outlook
8.1 Five Core Conclusions
Growth Engine Shift: Chinese game exports have transitioned from “traffic-driven” to “efficiency-driven.” Self-developed game overseas revenue reached USD 20.455 billion in 2025 (YoY +10.23%), with mobile growth (+13.16%) leading the pack.
Head Concentration Is Irreversible: The TOP 100 mobile games capture 57% of global revenue (USD 46.6 billion) and are still climbing. Mid-tier and small publishers must find survival space in niche segments, differentiated gameplay, and refined operations.
Genre Fusion Is a User Acquisition Revolution: The four major fusion directions — SLG+X, Hybrid Casual, Party Game+Social, and Idle+RPG — fundamentally use gameplay innovation to lower acquisition barriers and compound monetization to elevate user value.
Payment Moves from Backend to Front Stage: Global antitrust is driving third-party payment liberalization. Payment is no longer merely a transaction channel — it is a critical variable influencing 47% of user purchase decisions and serves as the “last funnel” connecting user value to corporate revenue.
Compound Monetization Is Now Standard: Over half of TOP 100 revenue-generating mobile games employ 5+ monetization strategies. The “pyramid payment structure” has become the standard configuration for a full-chain revenue system spanning retention to high-value payment.
8.2 Three Trend Forecasts
Payment Capability as Operational Capability: Future game publishers’ core competitiveness will encompass not only R&D and publishing, but also the degree of autonomy in payment infrastructure. Official website direct payment, payment middle-platforms, and localized payment coverage will become baseline requirements.
From “Product Export” to “Ecosystem Export”: Top publishers’ competition has already escalated from single-title showdowns to ecosystem competition — IP matrices, user account systems, proprietary payment channels, community operations, and esports ecosystems engaging across multiple dimensions.
Emerging Market Localization Depth Determines the Ceiling: The Middle East (+7.5%) and Latin America (+6.4%) significantly outpace mature markets in growth, but the high degree of localization in payment habits (Pix, GCash, UPI, etc.) means that “payment adaptation capability” will become the key variable determining market share.
This analysis is based on PhotonPay’s “2026 Global Game Operations White Paper: From Traffic Growth to Revenue Realization.” All data is current as of 2025-2026. Data sources are cited throughout the article.







No comments yet