

Executive Summary
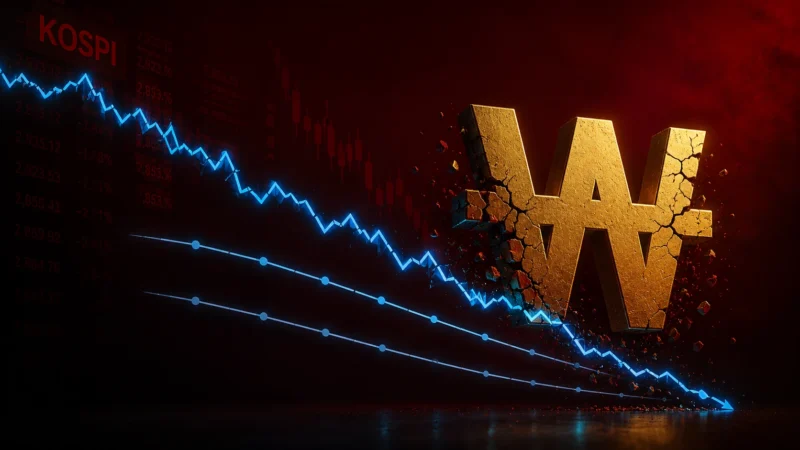
As of July 16, 2026, South Korea’s KOSPI index had plunged 27.3% from its June 19 peak, delivering one of the most violent corrections among major global equity markets this year. Yet the sell-off presents a paradox: valuations remain at historical lows while panic indicators (VKOSPI/VIX ratio) are at historical highs — a combination GF Securities strategists Liu Chenming and Chen Zhenwei describe as “low valuation, high panic” divergence.
In this landmark July 20, 2026 report, GF Securities argues that the KOSPI crash is not a classic valuation-bubble implosion. Instead, it is driven by three overlapping forces: (1) extreme index concentration — Samsung Electronics and SK Hynix together account for over 50% of KOSPI market capitalization, making the entire index a de facto AI/semiconductor proxy; (2) the rapid unwinding of a three-layer leverage structure — credit financing, derivatives, and leveraged ETFs — that had accumulated to historically extreme levels; and (3) a structural counterparty shift as foreign investors and institutions sell while retail investors absorb, transferring chips toward the household sector.
Drawing on historical parallels from the 2015 China A-share crash and the 2022 US tech deleveraging cycle, the report provides a granular, data-rich assessment of where Korea’s deleveraging stands — and a five-dimensional daily monitoring framework to gauge whether the current correction will evolve into a systemic liquidity crisis.
Table of Contents
- The Paradox: Low Valuations, High Panic — Why KOSPI Crashed 27%
- The Three-Layer Leverage Structure: Who Is Leveraged and How
- Credit Financing: Still in Early-Stage Deleveraging
- Leveraged ETFs: The Core Risk — Single-Stock Products and the Rebalancing Spiral
- Derivatives Leverage: Foreign & Institutional Exposure at 20-Year Highs
- Counterparty Dynamics: Foreigners Sell, Retail Absorbs
- Historical Benchmarks: 2015 A-Shares vs. 2022 US Tech
- Where Does Korea Stand Now? The Deleveraging Progress Scorecard
- The Five-Dimensional Monitoring Framework
- Three Risk Transmission Chains to Watch
- Risk Warnings
- Key Takeaways
Part 1: The Paradox — Low Valuations, High Panic
1.1 The Numbers
Table 1: KOSPI Correction Summary (as of July 16, 2026)
| Metric | Value |
|---|---|
| Peak date | June 19, 2026 |
| Decline from peak | -27.3% |
| Position vs MA50 | ~15% below 50-day moving average |
| Samsung + SK Hynix share of KOSPI market cap | >50% |
| KOSPI forward P/E | Historical low (depressed by surging earnings expectations) |
Source: GF Securities, Bloomberg, KRX
Table 2: Key Index Performance — YTD 2026 (through June 19 peak)
| Instrument | YTD Performance at Peak |
|---|---|
| KOSPI Index | +high double-digit % |
| Samsung Electronics | +significant % |
| SK Hynix | +significant % |
Source: GF Securities, Bloomberg
The KOSPI peaked on June 19, 2026, then entered a violent drawdown phase. In a single day — July 13, 2026 — the index plunged 8.95%. Another sharp drop of 6.37% followed on July 16. By that point, the index had fallen 27.3% from its peak and was trading approximately 15% below its 50-day moving average — a clear breakdown of both price and medium-term trend.
1.2 The Valuation Paradox Explained
GF Securities identifies a critical nuance: KOSPI’s low forward P/E ratio is a mirage. The index’s valuation is mechanically compressed by surging earnings expectations for Samsung Electronics and SK Hynix — expectations that already embed discounting for memory cycle sustainability and AI capex durability. Should those earnings estimates be revised downward, the “cheap” valuation evaporates.
Moreover, with two stocks comprising over half of the index, KOSPI is not a diversified equity benchmark — it is fundamentally a concentrated bet on the AI semiconductor theme. When crowded positioning in that single theme begins to unwind, the entire index moves.
1.3 The VKOSPI Signal: Korea-Specific Panic Pricing
Table 3: Volatility and Sentiment Indicators
| Indicator | Status (as of mid-July 2026) |
|---|---|
| KOSPI Put/Call Ratio vs NASDAQ Put/Call Ratio | Accelerating upward since early April |
| VKOSPI/VIX ratio | At historical highs (>2 std above mean) |
| 90-day implied volatility | Elevated |
| Directional pessimism | Not yet extreme (put/call ratio suggests hedging, not capitulation) |
Source: GF Securities, KRX, Bloomberg
The GF Securities analysis draws a crucial distinction: directional pessimism (measured by put/call ratios) is not yet extreme — investors are hedging, not capitulating. However, VKOSPI relative to VIX is at historically elevated levels, indicating that the Korean market is pricing in a uniquely high tail-risk premium that is not explained by global risk appetite alone.
“The low valuation did not eliminate investor concerns about tail risk and violent volatility.” — GF Securities
Part 2: The Three-Layer Leverage Structure
GF Securities identifies three distinct types of leverage operating simultaneously in the KOSPI market, each with different risk transmission mechanisms:
Table 4: Three Types of Leverage in KOSPI
| Leverage Type | Mechanism | Primary Participants | Risk Transmission |
|---|---|---|---|
| Credit Financing (Margin Lending) | Borrowed funds to expand stock positions | Retail + some institutions | Margin call → forced liquidation → “margin call feedback loop” |
| Exchange-Traded Derivatives | Futures/options margin trading amplifying nominal exposure | Foreign & institutional (dominant) | Margin pressure during drawdowns → position unwinding |
| Leveraged ETFs | Internal leverage via swaps/futures/borrowing with daily rebalancing | Retail (dominant) | “Rebalancing spiral” — mechanical selling on down days amplifies declines |
Source: GF Securities
Why Three Layers Matter
The coexistence of all three leverage types — each with different participants — creates a multi-layered vulnerability. Credit leverage unwinds through margin calls. Derivatives leverage unwinds through position reduction by sophisticated institutions. Leveraged ETF unwinding is automatic and mechanical — it does not require anyone to “decide” to sell.
In a severe downturn, all three can activate simultaneously, producing what GF Securities terms “active and passive deleveraging resonance.”





No comments yet